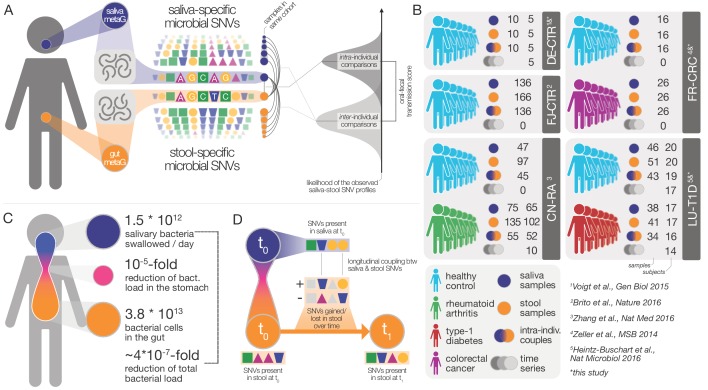
Figure 1. Data and workflow overview.
(A) Oral-fecal transmission scores were calculated from salivary and fecal microbial SNV profiles. (B) Cohort and dataset overview. For longitudinal cohorts (DE-CTR, CN-RA and LU-T1D), both the total number of samples and the number of individuals are shown, as well as the number of individuals considered in time-series analyses. (C) Salivary and fecal microbial loads allow the calculation of physiologically expected levels of ‘passive’ microbial transmission (i.e., by ingestion, without growth). (D) The longitudinal coupling of microbial SNVs between salivary and fecal samples was used to infer transmission directionality and oral-fecal transmission rates (see Materials and methods).


