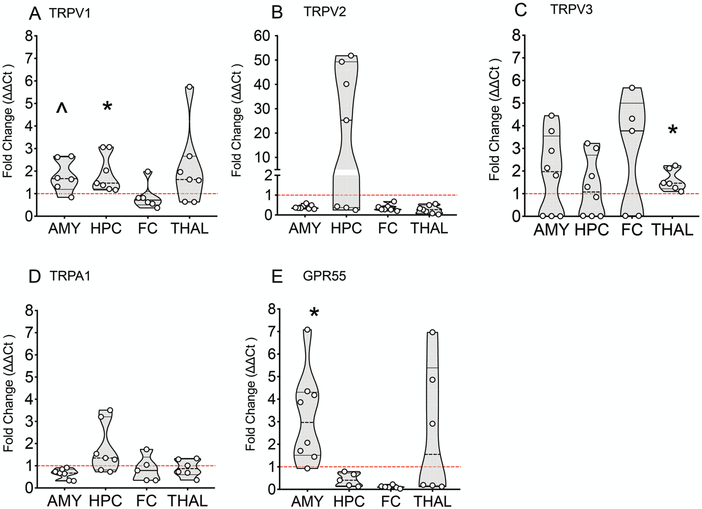
Figure 6. mRNA expression levels of TRPV1, TRPV3, and GPR55 increase as a factor of age from postnatal day 10 to postnatal day 20 in rats.
Violin plot illustrating the fold change in TRPV1 (A), TRPV2 (B), TRPV3 (C), TRPA1 (D), and GPR55 (E) mRNA expression in P20 rats over P10 expression. *p<0.05, ^p=0.052 over P10 levels, one-sample t-test, Holm-Sidak corrected.

