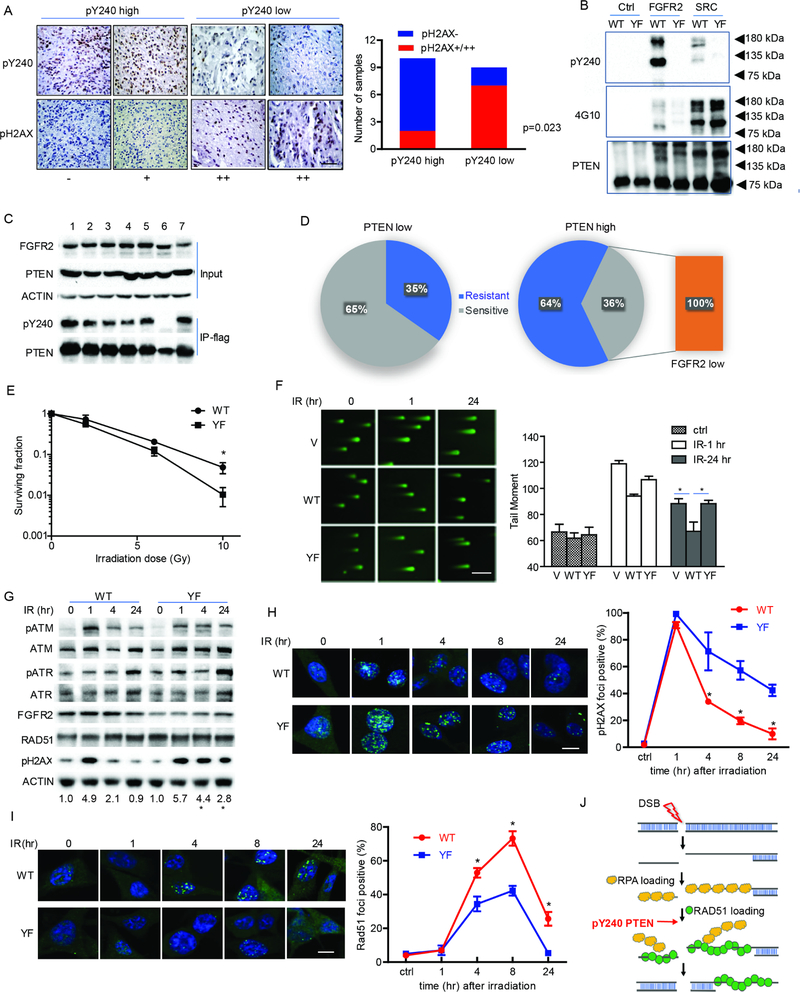
Figure 1. FGFR2-mediated phosphorylation of PTEN tyrosine 240 protects cells from DNA damage by facilitating DNA repair.
(A) Tumor samples from 19 GBM patients were stained with pY240-PTEN and pH2AX antibodies. Representative images for different staining intensity and quantification of the staining results are shown (Fisher’s exact test) between pY240-PTEN and pH2AX. Scale bar, 100 μm. (B) In vitro kinase assay was performed by incubating recombinant FGFR2 and Src with recombinant GST-PTEN (WT and Y240F (YF)). A phos-tag gel was used to separate the phosphorylated and un-phosphorylated protein followed by probing with anti-pY240-PTEN antibody and a pan-tyrosine phosphorylation antibody, 4G10. (C) 293T cells were transfected with FGFR2 [1. Y486F; 2. Y586F; 3. Y733F; 4. Y769F; 5. Y586/588F; 6. Y656/657F (kinase dead); 7. WT] together with Flag-tagged PTEN. Cell lysates were prepared for immunoprecipitation followed by immunoblotting with anti-pY240-PTEN. (D) 43 patient-derived glioma stem cell lines were evaluated for PTEN and FGFRs expression by RNAseq and for radiation sensitivity by clonogenic assay. Distribution of radiation sensitive and radiation resistant samples in PTEN high versus PTEN low group are shown. Orange rectangle indicates all radiation sensitive samples in PTEN low group showed low level of FGFR2 expression. PTEN high/PTEN low, PTEN expression is higher/lower than the median value (RNAseq); FGFR2 low, FGFR2 expression is lower than median value (RNAseq) (E) U87-WT/YF-PTEN cells in the presence of FGFR2 were treated with or without IR (0–10 Gy) and seeded in 10 cm dishes. Colonies were counted after 14 days and surviving fraction was calculated as the ratio of the plating efficiency of the treated cells to that of control cells. Data represents mean ± SEM from six independent experiments, *p<0.05. (F) U87-empty vector (V), WT/YF-PTEN cells, together with FGFR2 were irradiated with 10 Gy and then subjected to the comet assay at indicated time points. Tail moment was quantified and graphed for each group. Scale bar, 500 μm. (G) U87-WT/YFPTEN cells were irradiated with 10 Gy and DNA damage response pathway was examined by western blot at indicated times. Numbers at bottom showed a ratio of pH2AX levels relative to time 0 after normalization to actin, *p<0.05 was generated by comparing WT- and YF-PTEN samples at the same times. (H and I) Cells were treated with 10 Gy IR and then were stained at the indicated times with antibodies to γH2AX (H) and RAD51 (I). Cells containing more than 8 foci (γH2AX) or 5 foci (RAD51) were scored as positive. Scale bar, 25 μm. (F, H and I) Error bars are SD of at least three replicates and represent at least three independent experiments., *p<0.05. (J) Schematic representative of DNA damage pathway and pY240-PTEN is involved in regulating RAD51 recruitment to damaged DNA. See also Table S1–3 and Figure S1.

