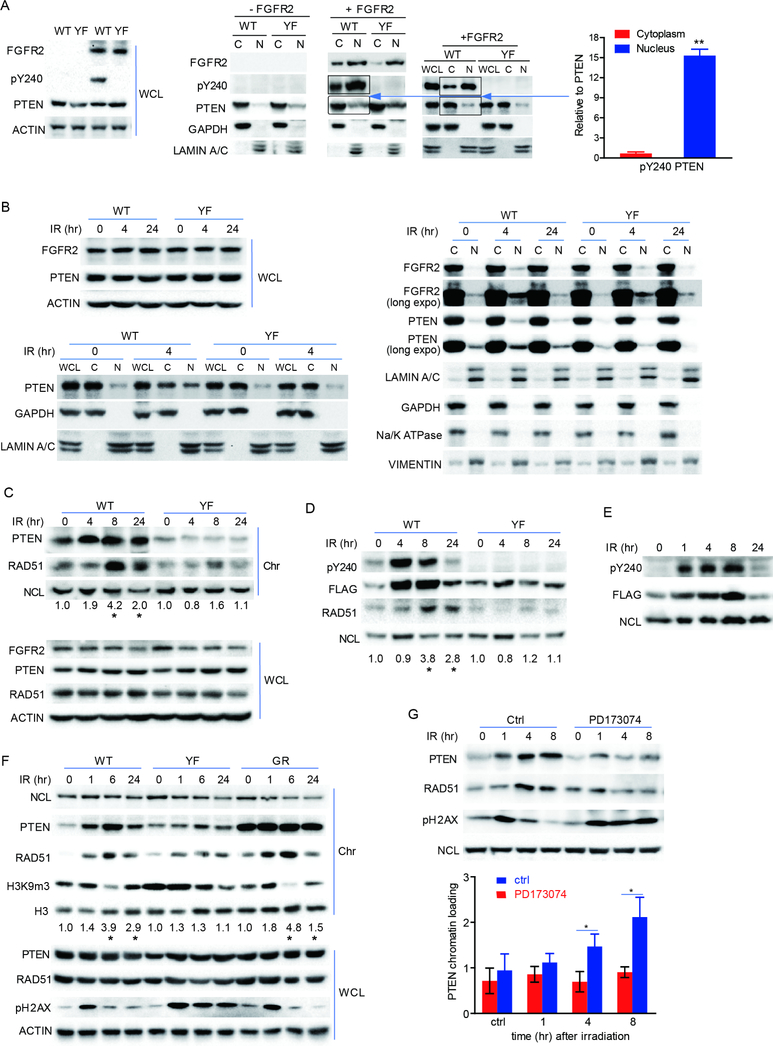
Figure 3. Nuclear localization and chromatin association of pY240 PTEN was elevated in response to IR treatment.
(A) 293T cells were co-transfected with FGFR2 or empty vector along with WT- or YF-PTEN. Cytoplasm (C) and nuclear fractions (N) were prepared for detection of pY240-PTEN. Bar graph on the right represents the ratio of cytoplasmic or nuclear pY240-PTEN to total cytoplasmic or nuclear PTEN respectively (bands inside the boxes). left panel represents the expression level of the indicated proteins in whole cell lysates. (B) U87-WT/YF-PTEN cells along with FGFR2 were irradiated at 10 Gy and whole cell lysates (left top) and cell fractionations (left bottom and right) were collected at indicated times followed by immunoblotting with anti-PTEN and anti-FGFR2 antibodies. Results represent equal cell equivalents of nuclear and cytosolic fractions. WCL, whole cell lysates; C, cytoplasm; N, nuclear. Long expo, longer exposure time. (C) U87-WT/YF-PTEN cells were treated with 10 Gy IR and chromatin fractions were prepared at the indicated times. PTEN and RAD51 from chromatin fraction (Chr) and WCL were examined by western blot. NCL, nucleolin, used as loading control for chromatin fraction. (D) Chromatin bound total PTEN and pY240 PTEN from WT or YF PTEN overexpressing 293T cells was compared by western blot over time after treatment with 10 Gy IR. (E) pY240-PTEN was monitored over time up to 24 hr after IR treatment in 293T cells. (F) Chromatin bound total PTEN, RAD51 and trimethylation lysine 9 of histone 3 (H3K9m3) were compared by western blot over time after treatment of WT-, YF- or GR-PTEN reconstituted cells with 10 Gy IR. Numbers in C, D, F indicate ratio of RAD51 levels relative to time 0 after normalization to NCL, *p<0.05 was generated by comparing WT- and YFPTEN samples at the same time point. (G) Chromatin bound PTEN was assessed in U87-WT PTEN with and without 1 μM PD173074 treatment and normalized to NCL (bar graph). Error bars in this figure represent SD of three independent experiments, *p<0.05. See also Figure S2

