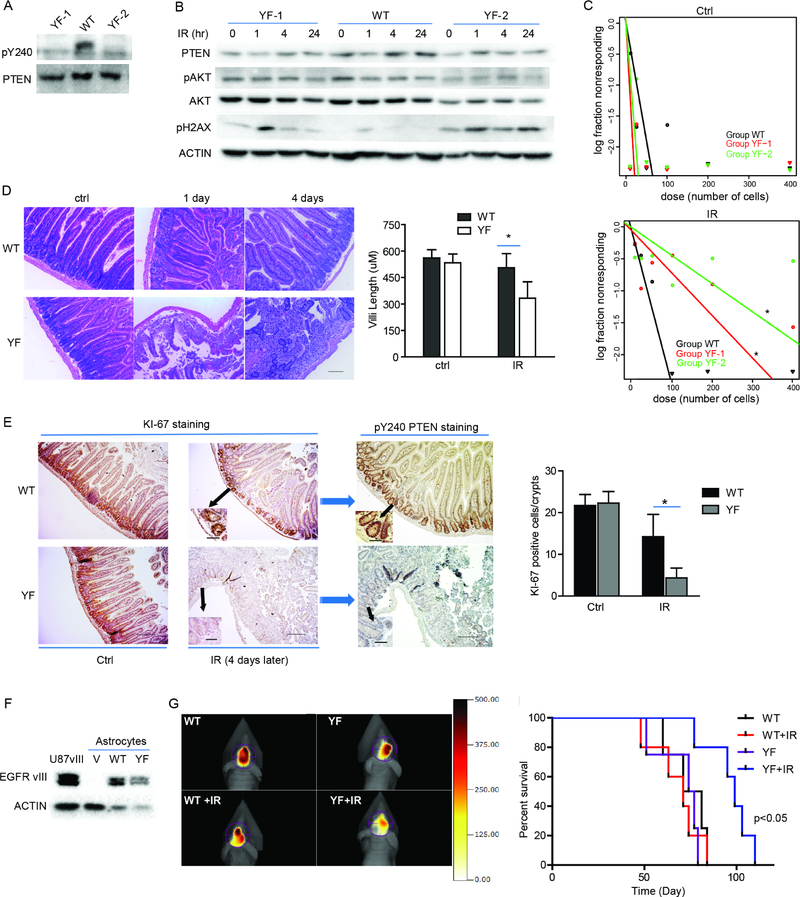
Figure 6. Y240F-Pten knock-in mice are more sensitive to IR treatment.
(A) Primary neurospheres were prepared from E16.5 WT and Y240F-Pten mice embryos and cell lysates from two representative Y240F Pten neurospheres (YF-1 ad YF-2) and one WT Pten neurosphere were prepared, immunoprecipitated with anti-PTEN antibody and examined for pY240-PTEN. (B) Neurospheres were treated with or without 3 Gy IR. Cell lysates were collected at indicated times and pH2AX was examined. (C) Survival of neurospheres treated as in (B) were evaluated by limiting dilution assay. (D) WT- and YF-Pten mice were treated with 8Gy whole body IR. Representative images show H&E staining of sections from proximal small intestine at indicated times post IR. Scale bar, 100 μM. Bar graph on the right indicates villus height measured from H&E staining images. (E) Representative images of Ki-67 staining indicating proliferating cells in intestinal crypts and pY240-PTEN staining from mice in (D). Scale bar, 200 μM. Inset scale bar, 50 μM. Bar graph on the right indicates quantification of Ki-67-positive cells per crypt. 30 crypts were assessed from each mouse. (F) Astrocytes from Cdkn2a null; WT and YF Pten mice were transduced with EGFRvIII to generate tumorigenic cell lines. Western blot illustrates expression of EGFRvIII, with U87 cells stably reconstituted with EGFRvIII as control. (G) Cells from panel (F) were used for intra-cranial engraftment (0.5×10⁶ per mouse) followed by IR treatment after tumor establishment. Representative images at day 72 were shown. (H) Kaplan-Meier analysis of survival. Quantification data represent mean ± SD from three independent experiments. *p<0.05. See also Figure S5.

