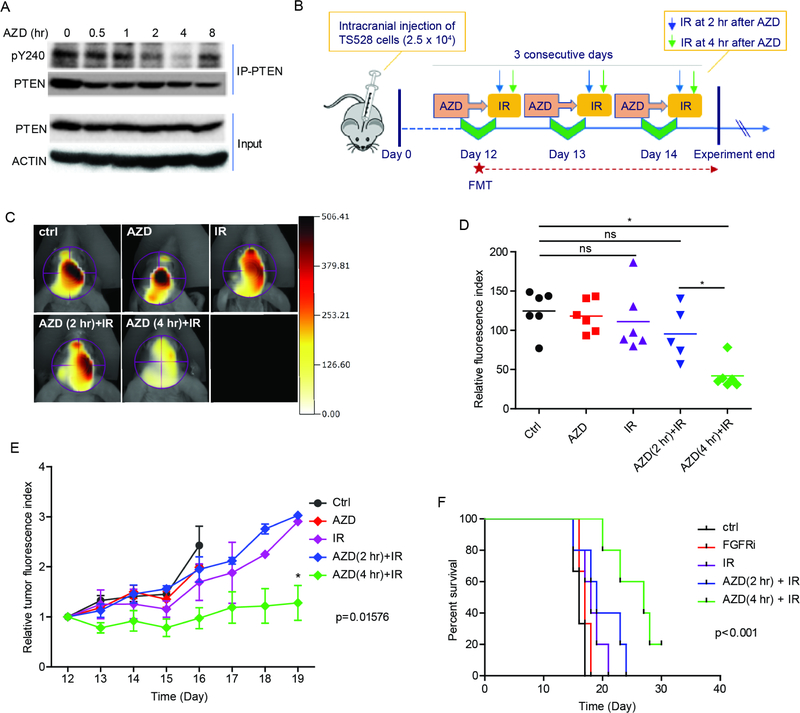
Figure 7. Inhibiting PTEN Y240 phosphorylation sensitizes to therapies.
(A) TS528 cells were intracranially injected into immunodeficient mice to establish tumors. Mice were administrated FGFR inhibitor AZD4547 (50 mg/Kg) by gavage at day 12 after injection. Tumor tissues were collected at indicated times after treatment and lysates were prepared for immunoprecipitation with PTEN. Presence of pY240-PTEN was determined by western blot. (B) Schematic representation of preclinical study design and experimental workflow. Tumor burden was evaluated by three-dimensional (3D) fluorescence molecular tomographic (FMT) imaging system starting at day 12. (C) Representative images of tumor FMT signal taken at day 14 are shown. Ctrl, vehicle; AZD, 50 mg/Kg AZD4547; IR, 2.5 Gy; AZD (2 hr)-IR or AZD (4 hr)-IR, treated with 2.5 Gy IR after 2 or 4 hr of AZD treatment. (D) Quantification of FMT signal intensity from (C). Colored horizontal bars indicate mean value of each group. ns, not significant between ctrl group and AZD, IR or AZD (2 hr)-IR group. (E) FMT signal monitored starting from day 12 (before treatment) to day 19. Signal intensity recorded from each point was quantified relative to day 12. Error bars are SD of at least three replicates. (F) Kaplan-Meier analysis of mice survival due to treatments in (B). *p<0.05. See also Figure S6 and S7.

