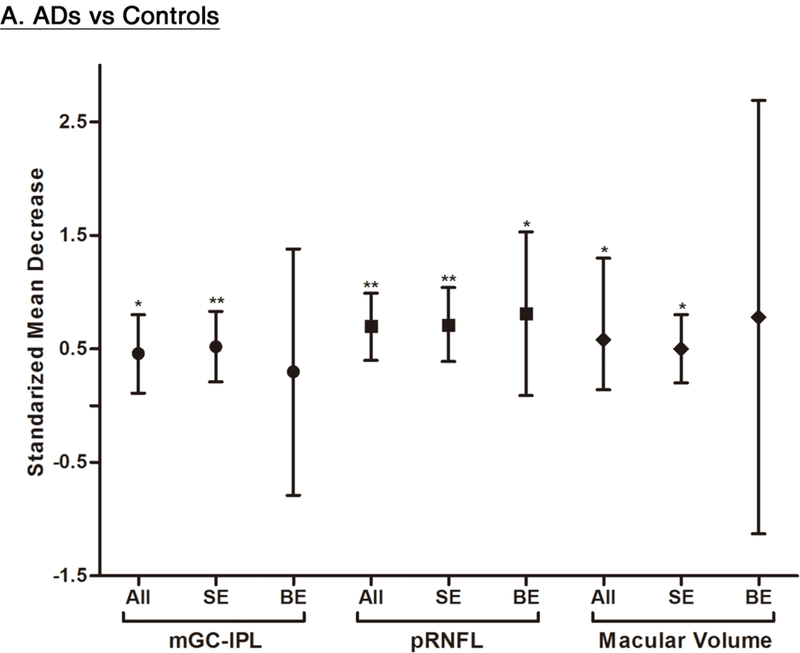
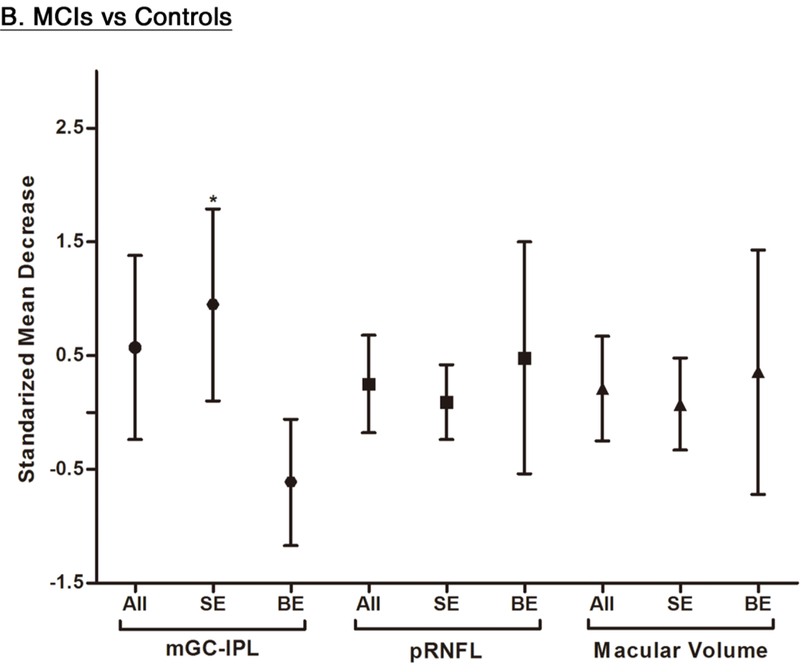
Figure 10: Subgroup Analyses according to the method of eye selection.


This figure illustrated the results of the subgroup analyses that included studies with single-eye dataset and studies with paired-eyes dataset, respectively. The bars represent the 95% confidence intervals of the standardized mean decreases. Significant group differences with p < 0.05 and p < 0.001 are labelled as “*” and “**” respectively. Abbreviations: SE = Single-eyes dataset; BE = Both-eyes/ paired-eyes dataset; ** = p<0.05; * = p<0.001
