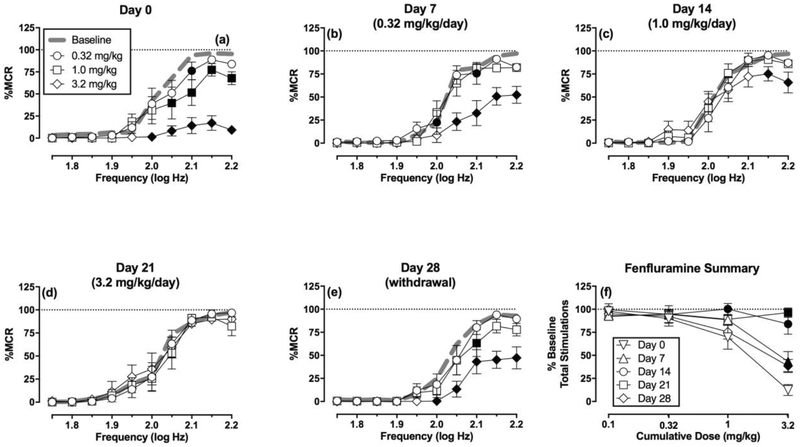
Figure 4. Effects of cumulative fenfluramine administration on ICSS before, during, and after repeated daily fenfluramine treatment (N=6).
Panels a-e show full frequency-rate curves on a given test day. The title of each panel shows the test day and the fenfluramine treatment administered daily for the six days preceding that test day. Abscissae: frequency of electrical brain stimulation in log Hz. Ordinates: percent maximum control reinforcement rate (% MCR) ± SEM (note that Baseline error is shown in Figure 2 but is not shown here for clarity). Filled symbols show significant differences relative to the baseline on that day as determined by repeated measure two-way analysis of variance (ANOVA) followed by Holm-Sidak post hoc test, p<0.05. Two-way ANOVA results indicated significant main effects of frequency in all panels (p<0.01). Statistical results for the main effect of fenfluramine dose and the frequency x dose interaction results were as follows: (a) Day 0: Dose [F(4,20)=25.17, p<0.01], Interaction [F(36,180)=9.67, p<0.01]; (b) Day 7: Dose [F(4,20)=25.20, p<0.01], Interaction [F(36,180)=4.22, p<0.01]; (c) Day 14: Dose [F(4,20)=0.69, p=0.61], Interaction [F(36,180)=1.80, p<0.01]; (d) Day 21: Dose [F(4,20)=0.90, p=0.48], Interaction [F(36,180)=0.81, p=0.76]; (e) Day 28: Dose [F(4,20)=20.28, p<0.01], Interaction [F(36,180)=3.09, p<0.01]. Panel f compares fenfluramine effects across test days on the summary measure of ICSS. Abscissa: cumulative fenfluramine dose in mg/kg. Ordinate: Percent Total Baseline Stimulations per Component ± SEM. There were significant main effects of fenfluramine dose [F(3,15)=25.76, p<0.01] and test day [F(4,20)=7.42, p<0.01], and the interaction was also significant [F(12,60)=7.80, p<0.01].

