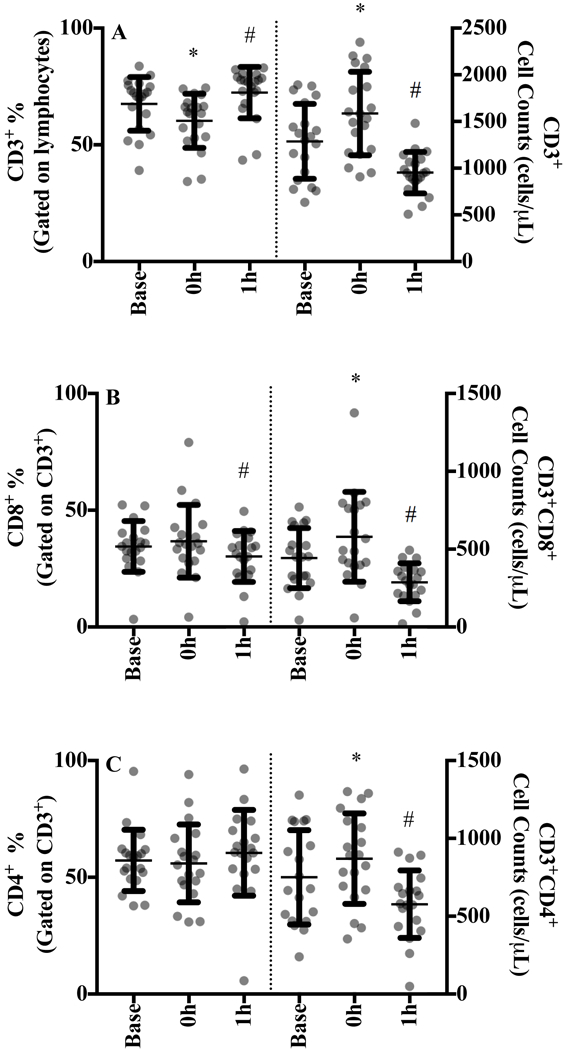
Figure 1.

A) CD3+ T-cells, B) CD3+CD8+ T cells, and C) CD3+CD4+ T-cells at baseline, 0 h and 1 h after sub-maximal aerobic exercise for n=20. T-cells are expressed as a percentage of their parent population in the left panel and the absolute cell counts are displayed in the right panel.
* p<0.05 from all time points, # p<0.05 from baseline
