Figure 22.

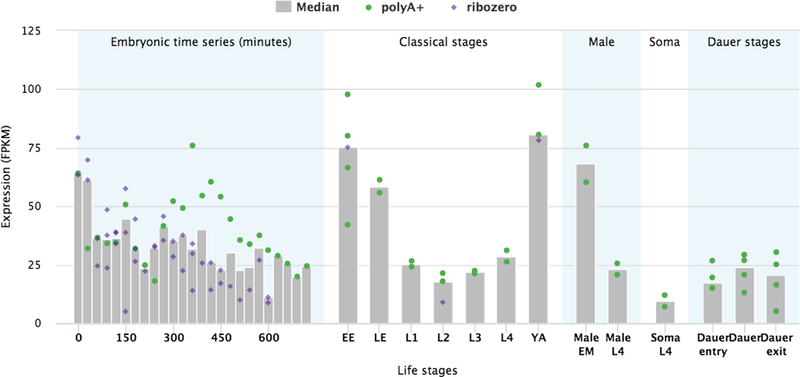
Bar-chart of the FPKM expression values of a gene during various life-stages. The values are produced from RNA-seq data of selected modENCODE libraries. The dots represent individual libraries, the grey bars indicate the median values.

Bar-chart of the FPKM expression values of a gene during various life-stages. The values are produced from RNA-seq data of selected modENCODE libraries. The dots represent individual libraries, the grey bars indicate the median values.