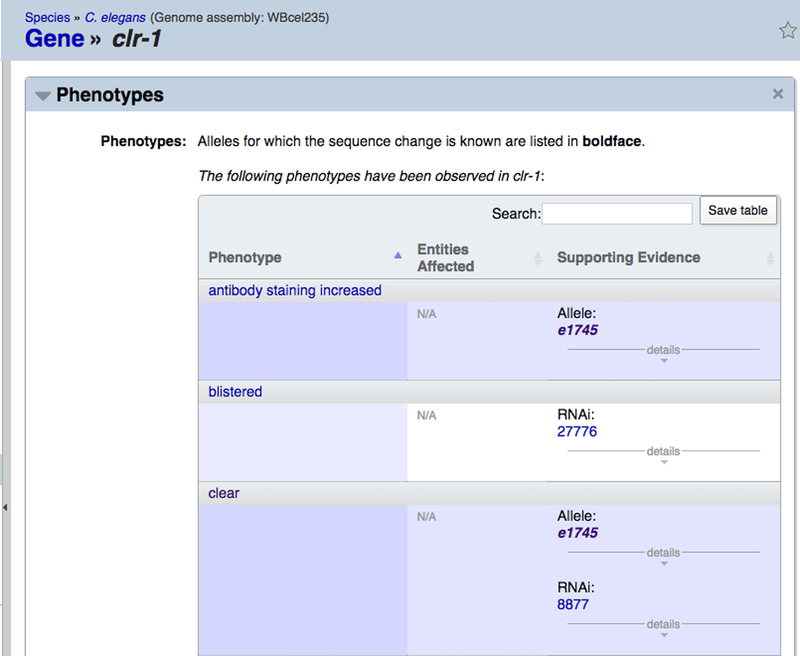
Figure 30.

The “Phenotypes” widget on a gene report page displays the phenotypes resulting from various perturbations of the focus gene. The topmost table displays observed phenotypes resulting from allele or RNAi perturbations, followed by a table of phenotypes assayed for but not observed for alleles or RNAi experiments. Below this is a table of interaction-based phenotypes and a table of overexpression phenotypes.
