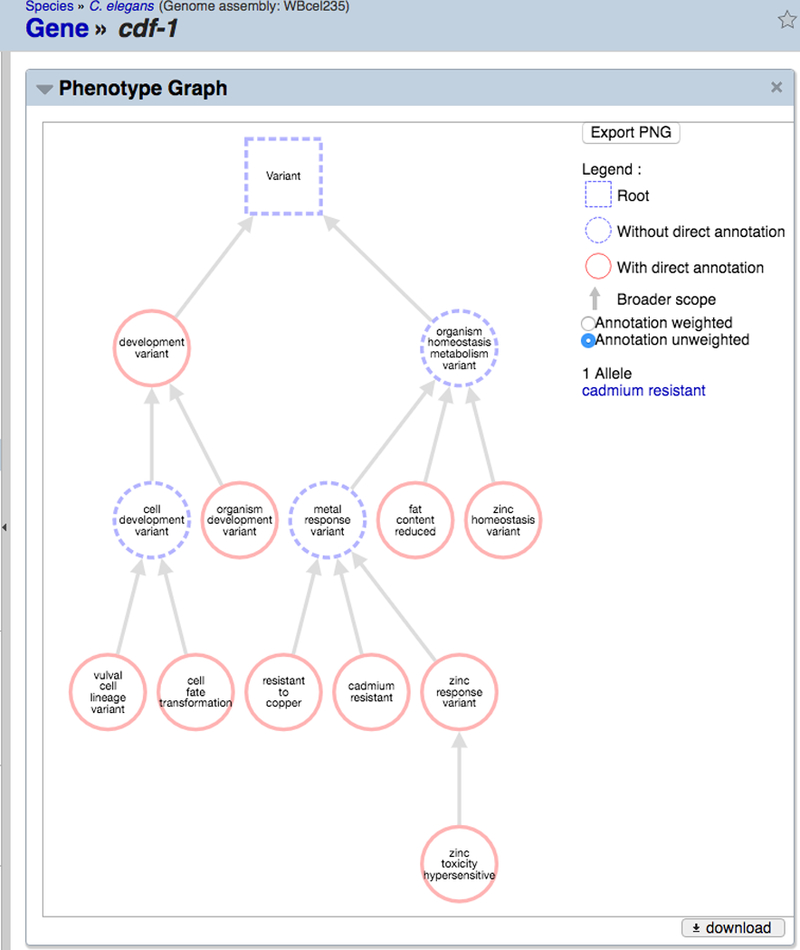
Figure 31.

The “Phenotype Graph” widget on gene report pages provides a concise ontology-guided graph view of phenotype annotations to enable more efficient perusal of phenotype terms annotated to the focus gene. The “Annotation weighted” view displays phenotypes as nodes whose size is proportional to the number of annotations to that term; the “Annotation unweighted” view displays each phenotype term as a node of the same size. Hovering the cursor over each node reveals the number and type of annotations to each term. The “Export PNG” button can be used to generate a PNG graphic file depicting the entire graph.
