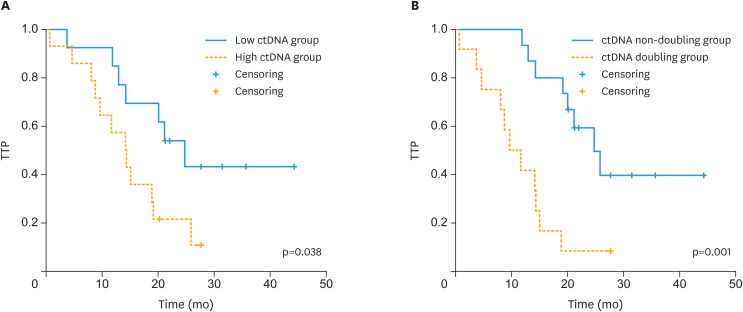
Fig. 2. Kaplan-Meier plots for change in ctDNA after 3 months of chemotherapy. (A) Kaplan-Meier curve showing TTP for patients with ctDNA levels <0.2 or ≥0.2 copies/µL at 3 months after the end of chemotherapy. (B) Kaplan-Meier curve showing TTP for patients whose ctDNA levels at 3 months after chemotherapy had not doubled or had doubled compared to those immediately after chemotherapy.
CA 125 = cancer antigen 125; ctDNA, circulating tumor DNA; TTP, time to progression.

