Figure 4.

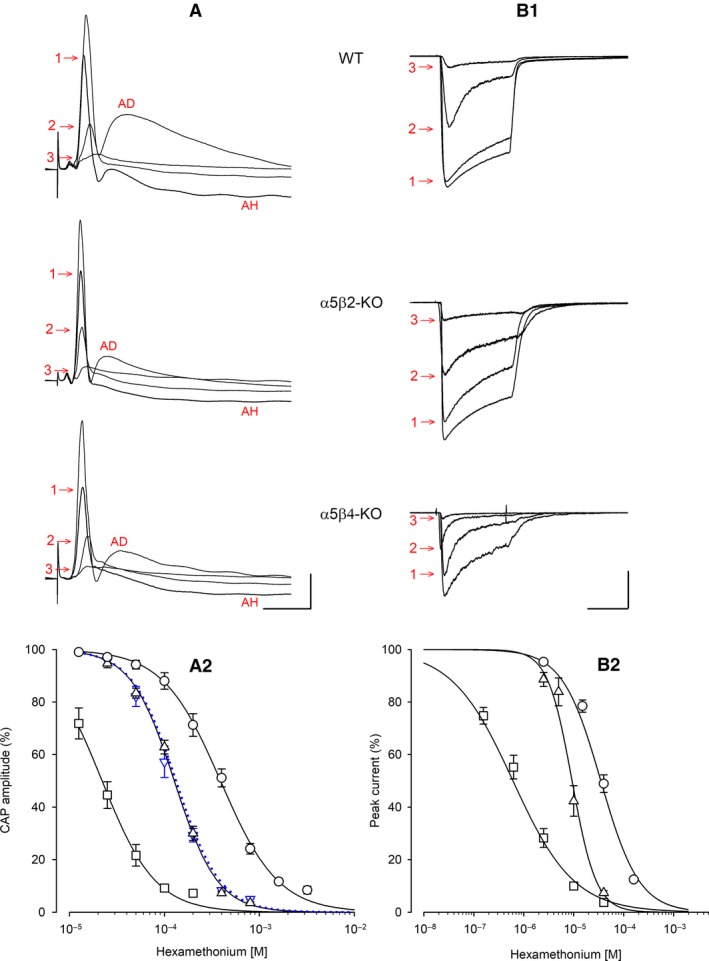
Hexamethonium (HM) inhibits CAP amplitude (in SCG ganglia) and ACh‐induced current (in cultured neurons) differently between WT, α5β2‐KO, and α5β4‐KO. Example traces and HM concentration‐response curves measured in WT (circles), α5β2‐KO (up‐triangles), and α5β4‐KO (squares) ganglia/neurons. (A1) Example traces of CAPs recorded in the absence or presence of HM. HM concentrations were 200 μmol/L (1), 800 μmol/L (2), and 1600 μmol/L (3) in WT ganglia; 100 μmol/L (1), 200 μmol/L (2), and 400 μmol/L (3) in α5β2‐KO ganglia; and 25 μmol/L (1), 50 μmol/L (2), and 100 μmol/L (3) in α5β4‐KO ganglia. Afterdepolarization (AD, prominent in the absence of HM) and afterhyperpolarization (AH, prominent in the presence of low HM concentrations) are likely due to Ca2+‐dependent activation of Cl− and K+ channels, respectively (Martinez‐Pinna et al. 2000). The horizontal and vertical scale bars represent 20 msec and 100 μV, respectively. (A2) HM concentration‐response curves of CAP inhibition. CAPs as shown in panel A1 were most potently inhibited in α5β4‐KO ganglia (IC 50 = 22.1 μmol/L, confidence interval: 18.7–25.3 μmol/L; Hill coefficient: −1.54; n = 10), followed by α5β2‐KO ganglia (126.7 μmol/L, confidence interval: 120.2–133.5 μmol/L; Hill coefficient: −1.9; n = 11) and WT ganglia (389.2 μmol/L, confidence interval: 356.0–425.5 μmol/L; Hill coefficient: −1.43; n = 10). The IC 50 values for WT and α5β2‐KO ganglia differed significantly (F 1,111 = 424.5, P < 0.0001, F‐test). The IC 50 of α5 single KO ganglia (119.0 μmol/L, confidence interval: 109.3–129.6 μmol/L, n = 6; down‐triangles, blue dotted line) did not differ from the IC 50 of α5β2‐KO ganglia (F 1,113 = 1.716, P = 0.193, F‐test). (B1) Example traces of currents induced by 2 sec pulses of 300 μmol/L ACh in the absence or presence of HM. HM concentrations were 10 μmol/L (1), 40 μmol/L (2), and 160 μmol/L (3) in WT neurons; 2.5 μmol/L (1), 10 μmol/L (2), and 40 μmol/L (3) in α5β2‐KO neurons; and 0.625 μmol/L (1), 2.5 μmol/L (2), and 10 μmol/L (3) in α5β4‐KO neurons. The horizontal scale bar represents 1 s. The vertical scale bar represents 2 nA and 1 nA for α5β2‐KO and α5β4‐KO neurons, respectively. (B2) HM concentration‐response curves of peak current inhibition. Currents as shown in panel B1 were most potently inhibited in α5β4‐KO neurons (IC 50 = 0.73 μmol/L, confidence interval: 0.59–0.89 μmol/L, Hill coefficient: −0.77; n = 17 neurons), followed by α5β2‐KO (9.28 μmol/L, confidence interval: 8.07–10.79 μmol/L: Hill coefficient: −1.8; n = 8) and WT (35.08 μmol/L, confidence interval: 30.61–40.15 μmol/L; Hill coefficient: −1.13; n = 20). The IC 50 values in α5β2‐KO and WT differ significantly (F 1,86 = 146, P < 0.0001, F‐test).
