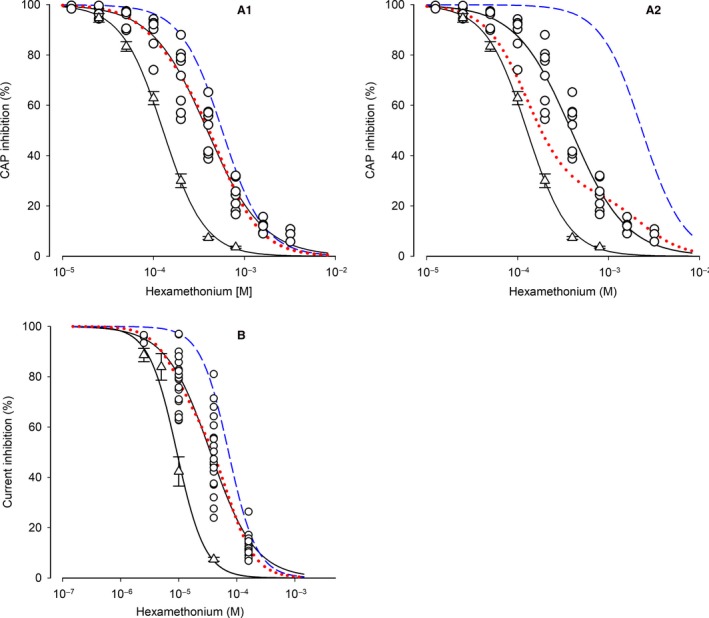
Figure 5.

Modeling of the contribution of α5‐containing receptors in synaptic transmission and ACh‐induced currents in WT SCG. (A1) HM concentration‐response curves of CAP inhibition for α5β2‐KO and WT ganglia are taken from Fig. 4A2. Circles are the individual data points observed in WT ganglia. The blue dashed curve was generated for the HM inhibition of α3β4α5 receptors by applying a Hill coefficient −1.9 and the fit parameter IC 50b = 568.6 μmol/L derived from Function (2) to the Hill function. The red dotted curve was generated by applying the following values to Function (2): f1 = 0.28 (the contribution of receptors lacking α5, derived from the fitting routine), (1‐f1) = 0.72 (the complementary contribution of α3β4α5 receptors), IC 50a = 126.7 μmol/L (IC 50 for α3β4 receptors), IC 50b = 568.6 μmol/L (IC 50 for α3β4α5 receptors, derived from the fitting routine), and the Hill coefficient −1.9. Please note the almost perfect overlay of the red dotted curve and the HM concentration‐response curve in WT ganglia. Based on this modeling approach, α3β4α5 receptors contribute 72% to overall nAChRs that mediate synaptic transmission in the mouse SCG. Details of the fitting routine: IC 50b = 568.6 μmol/L ± 58.24 μmol/L (10.2%); f 1 = 0.28 ± 0.05 (19%); final sum of squares of residuals: 2498.46; degrees of freedom: 48; rms of residuals: 7.21466; variance of residuals: 52.0514. (A2) The plot differs from the plot shown in A1 by the blue dashed and the red dotted curves. Here, the fitting routine was constrained by inserting a fixed f1 of 0.75 into Function (2), which reflects the proportion of receptors lacking the α5 subunit (as determined by previous IP experiments, David et al. 2010). Even with this constraint, the fit converged by calculating a HM IC 50b of 2.35 mM (for α3β4α5 receptors, blue dashed curve). The red dotted curve was thereafter generated by applying the following values to Function (2): f1 = 0.75, (1‐f1) = 0.25, IC 50a = 126.7 μmol/L, IC 50b = 2.35 mM, and the Hill coefficient −1.9. Please note that the red dotted curve clearly deviates from the data observed in WT ganglia. Details of the fitting routine: IC 50b = 2.35 mM ± 1.11 μmol/L (47.3%); f1 = fixed (0.75); final sum of squares of residuals: 12082; degrees of freedom: 49; rms of residuals: 15.70; variance of residuals: 246.57. Besides the (calculated) high IC 50b for HM, please also note its high variability. (B) HM concentration‐response curves of peak current inhibition in α5β2‐KO and WT neurons are taken from Fig. 4B2. Circles are the individual data points observed in WT SCG neurons. The blue dashed curve was generated for the HM inhibition of α3β4α5 receptors by applying a Hill coefficient ‐1.8 and the fit parameter IC 50b = 72.02 μmol/L derived from Function (2). The red dotted curve was generated by applying the following values to Function (2): f1 = 0.37 (the contribution of receptors lacking α5, derived from the fitting routine), (1‐f1) = 0.63 (the complementary contribution of α3β4α5 receptors), IC 50a = 9.28 μmol/L (IC 50 for α3β4 receptors), IC 50b = 72.02 μmol/L (IC 50 for α3β4α5 receptors, derived from the fitting routine), and the Hill coefficient −1.8. Please note the almost perfect overlay of the red dotted curve and the HM concentration‐response curve in WT ganglia. Based on this modeling approach, α3β4α5 receptors contribute 63% to overall nAChRs that mediate synaptic transmission in the mouse SCG. Details of the fitting routine: IC 50b = 72.02 μmol/L ± 10.57 μmol/L (14.7%); f1 = 0.37 ± 0.04 (12.5%); final sum of squares of residuals: 6641; degrees of freedom: 59; rms of residuals: 10.61; variance of residuals: 112.0.
