
Figure 5.
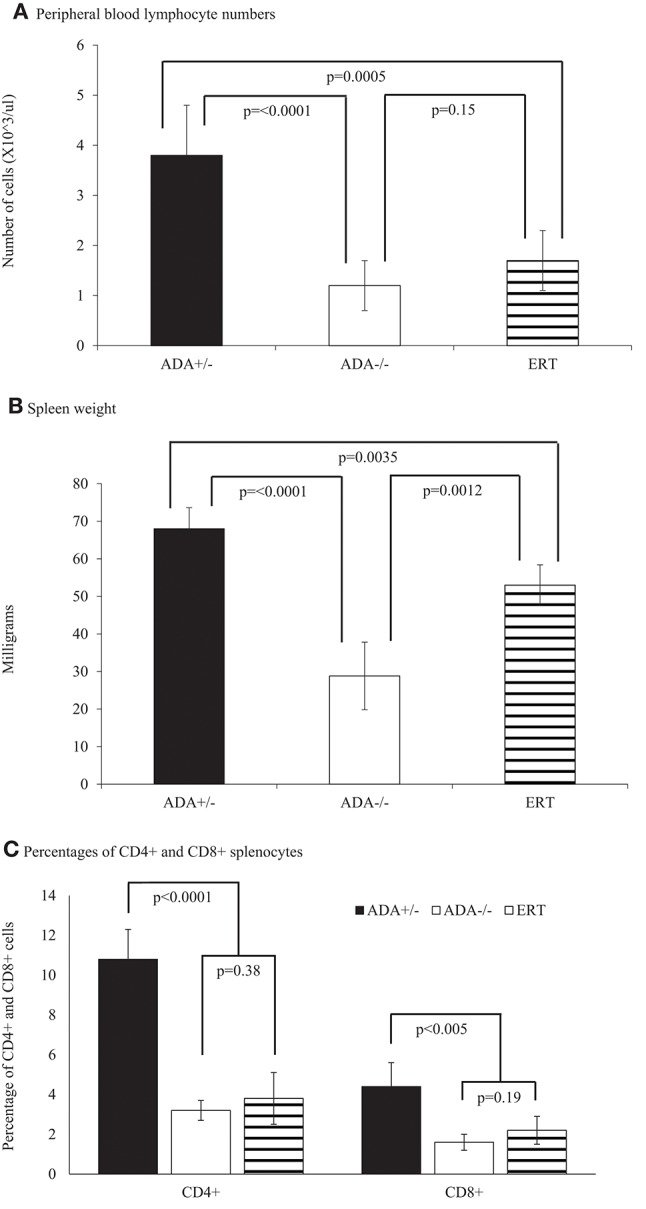
Lymphocytes and spleen analysis of 17 days pp ADA+/– mice, ADA–/– mice, and ADA–/– mice following ERT. Lymphocyte numbers (A), spleen weight (B) and percentages of CD4+ and CD8+ splenocytes (C) of 17 days postpartum (pp) ADA+/– healthy littermate control mice (filled square), ADA–/– mice (open square), and ADA–/– mice that received ERT initiated at 7 days pp (stripe pattern). Results are the mean and standard deviation of 3 independent experiments of 4–7 mice in each group.