Figure 7.

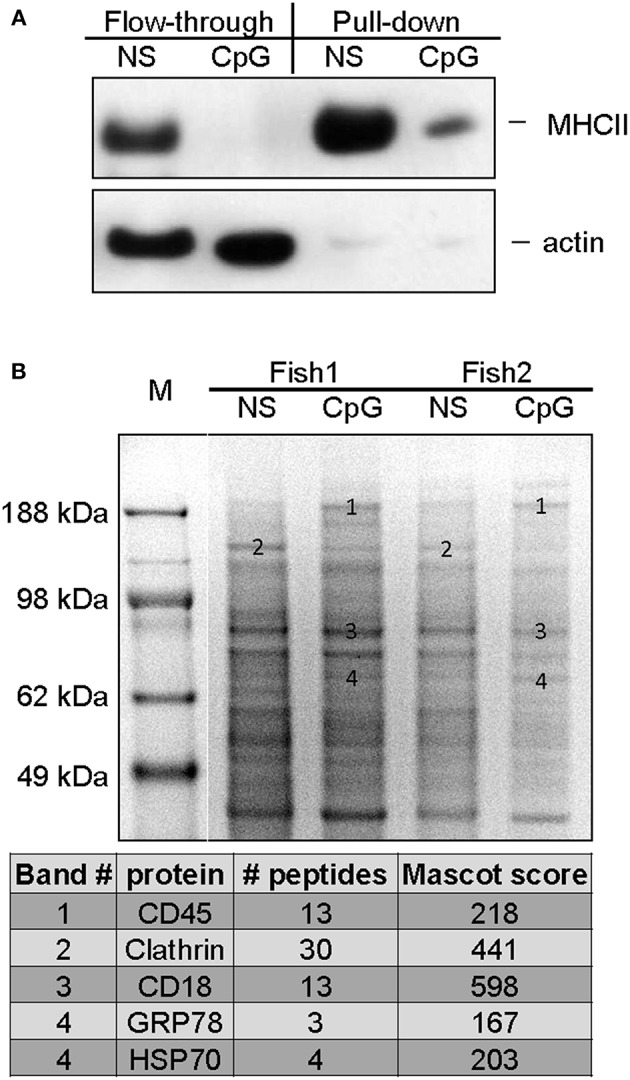
Mass spectrometry analysis of cell surface proteins of non-stimulated and CpG-treated salmon MPs. The cells were either left non-stimulated or were stimulated with CpGs for 7 days. Cell surface proteins were labeled with biotin and purified as described in Materials and methods. (A) The efficiency of the cell surface protein purification was confirmed with WB analysis. Flow-through and pull-down samples enriched in proteins associated with cell surface from control non-stimulated and CpG-stimulated cells were run on SDS PAGE and protein levels of MHCII-β and actin were detected with polyclonal antibodies. (B) Samples enriched in cell surface proteins isolated from cells of two individuals were run in parallel on SDS-PAGE, and stained with Coomassie. Bands of interest were excised, and subjected to MS/MS analysis. The table below the gel image lists identified proteins in bands whose ID numbers are indicated on the gel image.
