Figure 3.
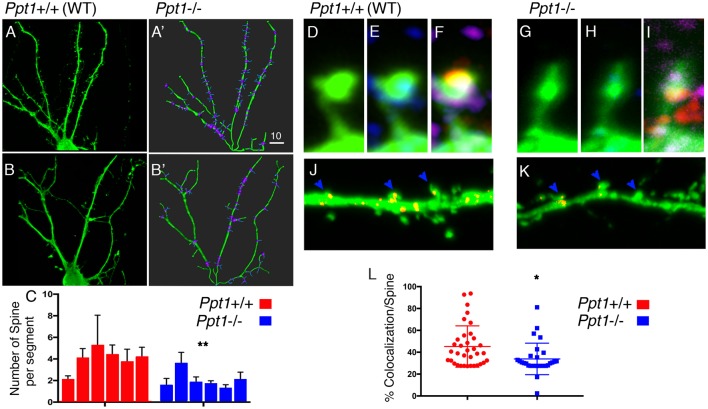
Spine density is modified in Ppt1−/− cultured hippocampal neurons. (A–C) Hippocampal neurons form control animals (A,A’) or Ppt1−/− littermates (B,B’) were transfected with GFP and grown for 14 days in culture. Dendrites (green) and dendritic spines (blue) were traced using Imaris Filament Tracer tool (A’,B’). (C) The numbers of spines branching off dendritic segments were computed from n = 6 cells in each group. Averages of the number of spines per each dendritic segment (branch points are highlighted in purple, see “Materials and Methods” section for details) and SEM are plotted, **P = 0.005. (D–L) Hippocampal neurons transfected with GFP (green, D,G) to mark dendritic spines, and immuno-stained with PSD95 (red, in E,H) to mark post-synaptic sites and SYNCRIP (SYP) to locate positive puncta along the dendrites. (J,K) SYNCRIP signal (Red) in control or Ppt1−/− hippocampal neurons, was masked outside the neurons, showing puncta accumulating in the head of control dendritic spines (J) vs. Ppt1 KO cells (K). (L) Colocalization of SYNCRIP in n = 36 WT and n = 29 Ppt1 KO dendritic spines, was measured and calculated as percentage of the general GFP signal, *P = 0.0101. The Dot plot chart is depicting all measured spines. Lines indicate average and SEM. Size markers (A’) 10 μM, (G) 1 μM, (K) 2 μM.

