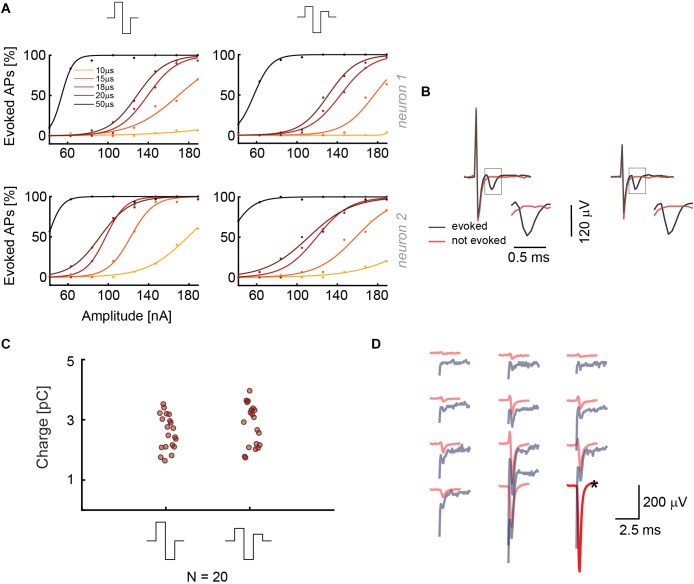
FIGURE 3.
(A) Results from current stimulation of two neurons. At the top, the two waveforms that were used are displayed. The efficacy in evoking APs is almost the same for both waveforms. 30 repetitions were used for every waveform, phase duration and stimulation signal amplitude in a randomized manner. (B) Recorded voltage signals including stimulation artifacts for successful and non-successful current stimulations are displayed for the two stimulation waveforms in panel A. No measures were taken to suppress the artifact. The close-ups show the region, in which the neuron’s response eventually occurred. The voltage signal (artifact only) recorded during/after a stimulation that did not evoke an AP is displayed in red, voltage signals (artifact plus superimposed neuronal response), recorded during a successful stimulation, are displayed in black. (C) The current stimulation results of 20 neurons are displayed. The points represent the smallest charges that evoked APs in 90% of the stimulations during 30 repetitions; the signal duration was 20 μs per phase. (D) Overlay of the spike-sorted spontaneous activity of a neuron (red) and its response (gray) upon current stimulation through the electrode marked with a black star (∗).

