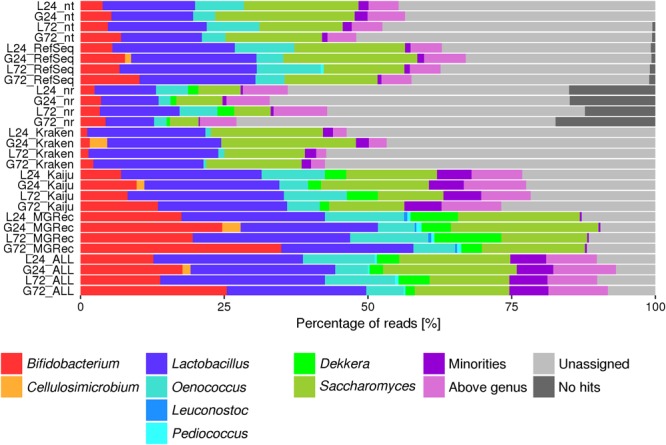
FIGURE 1.

Percentage of metagenomic sequence reads from water kefir fermentation metagenomes assigned to different genera using BLAST [NCBI nucleotide database (nt), RefSeq, or NCBI protein database (nr)], Kraken, Kaiju, metagenomic recruitment plotting (MGRec), or an overall taxonomic analysis (ALL). Actinobacteria are colored in shades of red/orange, Firmicutes in shades of blue, and yeasts in shades of green. The category “minorities” includes all genera that were represented by less than 0.5% of all reads. The category “above genus” represents all assigned taxonomic levels higher than the genus level.
