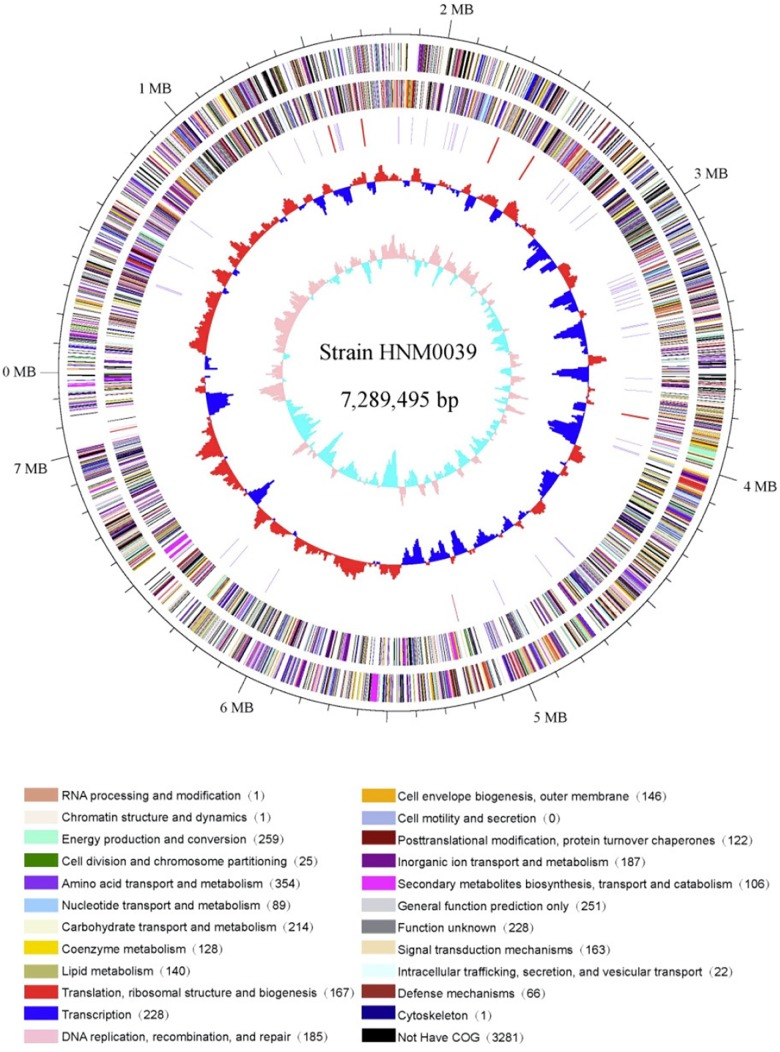
FIGURE 4.
Circular genome map of strain HNM0039T. The genome map was made using Circos ver. 0.64 (Krzywinski et al., 2009). The outer scale is numbered in intervals of 0.1 Mbp; Circles 1 and 2 display the distribution of genes related to COG categories in the forward strand and in the backward strand respectively; Circle 3 displays the tRNA genes and rRNA genes; Circle 4 displays the GC percentage plot (red above average, blue below average); Circle 5 displays the GC skew (lime red above average, light green below average).

