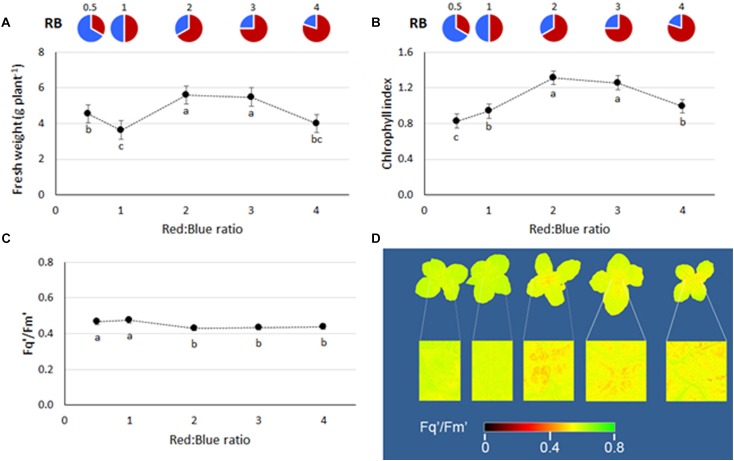
FIGURE 2.
(A) Fresh weight, (B) chlorophyll index, and (C) PSII quantum efficiency of basil plants grown under LED lights with different R:B ratio in the spectrum (RB0.5, RB1, RB2, RB3, and RB4). The data, referring to experiment 5, are presented as mean values ± SE (15 replicate plants). Different letters indicate significant differences at P ≤ 0.05. In (D), whole plant images created using PlantExplorerTM are included. The greater presence of red pixels indicates lower values of Fq′/Fm′, whereas higher yellow/green areas indicate higher Fq′/Fm′ values, as defined in the integrated legend.

