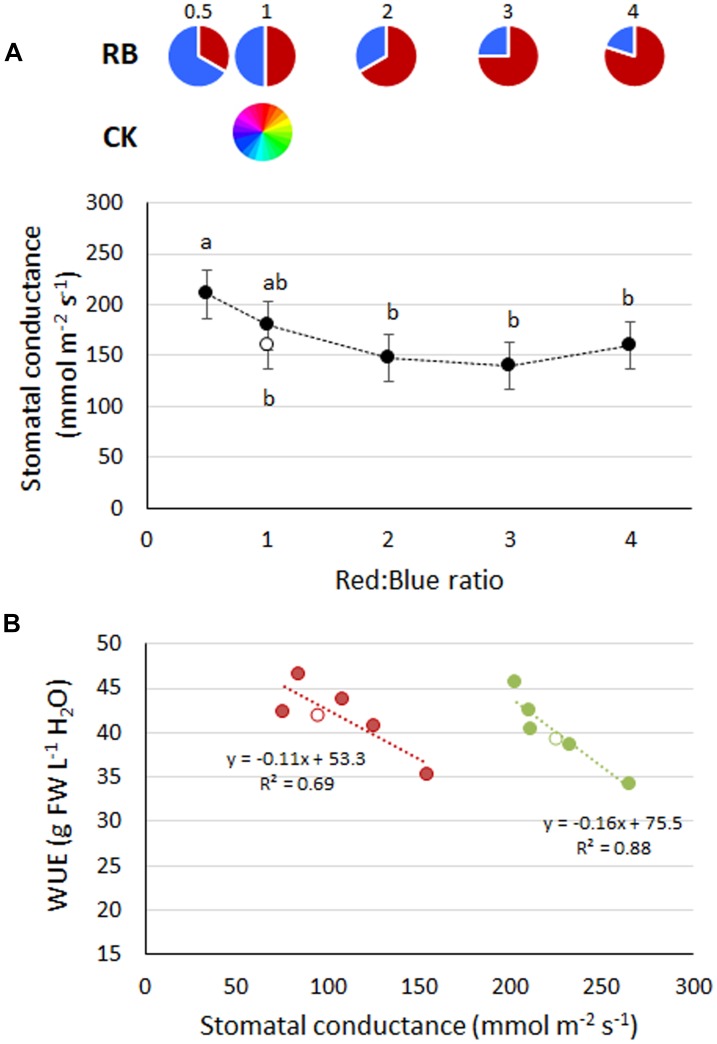
FIGURE 3.
(A) Stomatal conductance in basil plants grown under LED lights with different R:B ratio in the spectrum or under fluorescent light (open symbol). Mean values (experiments 3 and 4) ± SE (18 replicate plants). Different letters indicate significant differences at P ≤ 0.05. (B) Linear relationship in experiment 3 (red) and experiment 4 (green) between mean values of stomatal conductance and Water Use Efficiency (WUE). Open symbols represent CK1.

