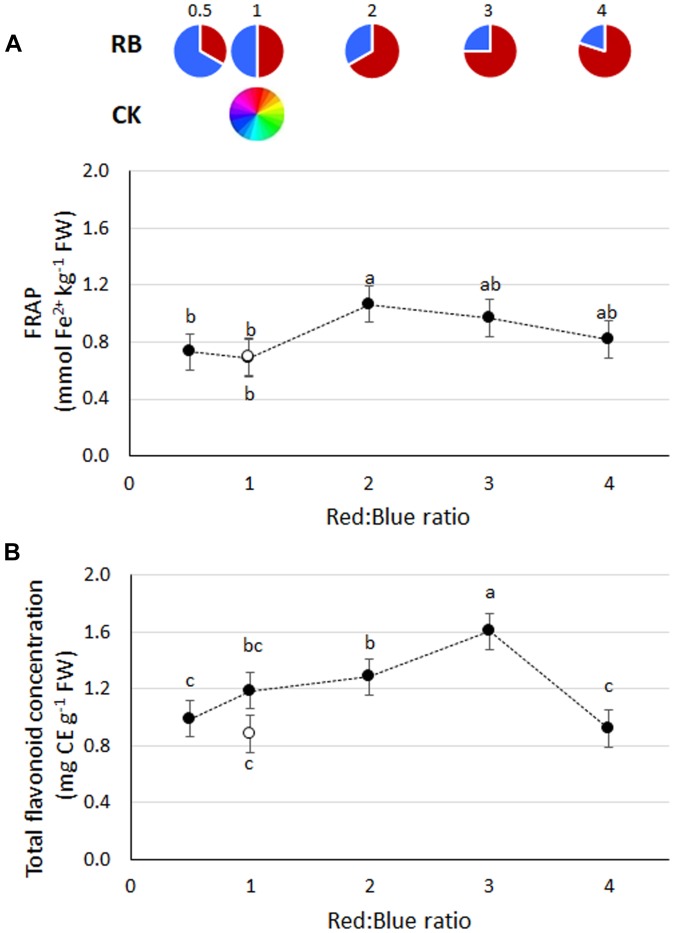
FIGURE 4.
(A) Antioxidant capacity (FRAP) and (B) total flavonoids concentration in basil plants grown under LED lights with different R:B ratio in the spectrum or under fluorescent light (open symbol). Data referring to experiments 2 and 3 are indicated as mean ± SE (18 replicate plants). Different letters indicate significant differences at P ≤ 0.05.

