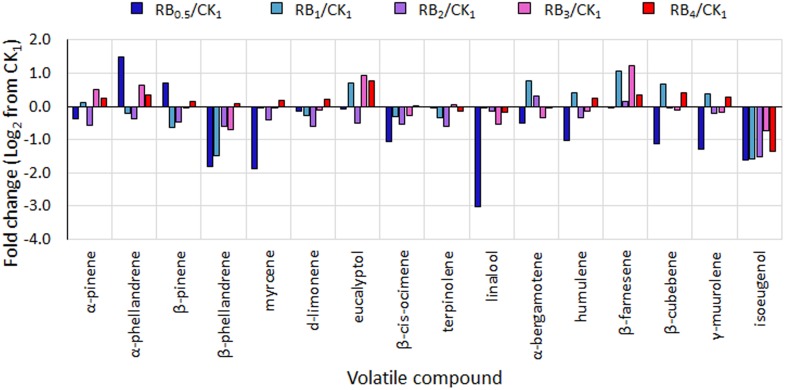
FIGURE 5.
Fold change from control treatment (fluorescent light, CK1) in the amount of selected volatiles in basil leaves from plants grown under LED lights with different R:B ratio in the spectrum (RB0.5, RB1, RB2, RB3, and RB4). Mean values of 3 replicate plants per treatment (experiment 3) ± SE (3 replicate plants).

