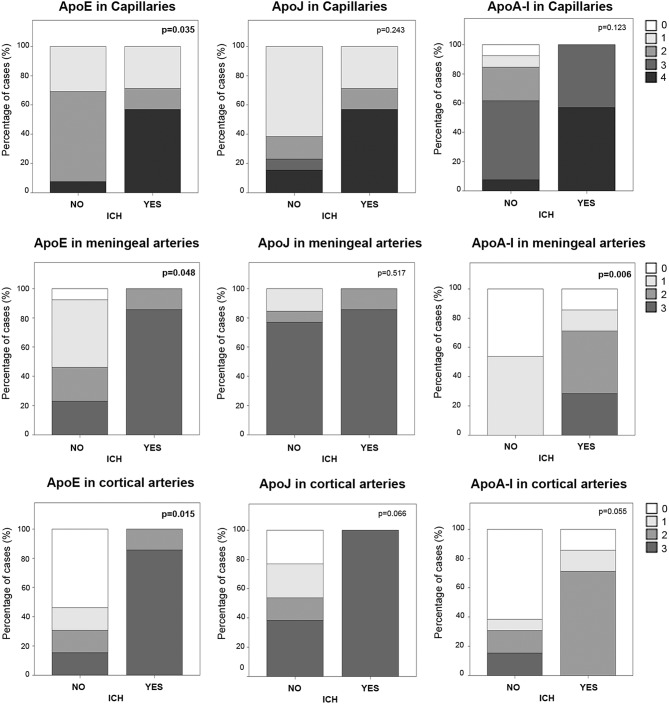
Figure 6.
Distribution of ApoE, ApoJ, and ApoA-I in capillaries and meningeal and cortical arteries in brains from subjects who had an intracerebral hemorrhage (ICH) or not. Graphs represent the percentage of samples in each group (presenting ICH or not). The presence in brain capillaries was classified as 0: no staining; 1: focal and granular wall staining (<50% of the capillaries); 2: focal and linear wall staining (<50% of the capillaries); 3: diffuse wall staining (>50% of the capillaries); 4: strong staining. The presence in brain arteries was classified as 0: no staining; 1: staining in <30% of the vessels; 2: staining in 30–75% of the vessels; 3: staining in >75% of the vessels. Statistical differences were calculated using the Chi Square (χ2) test.

