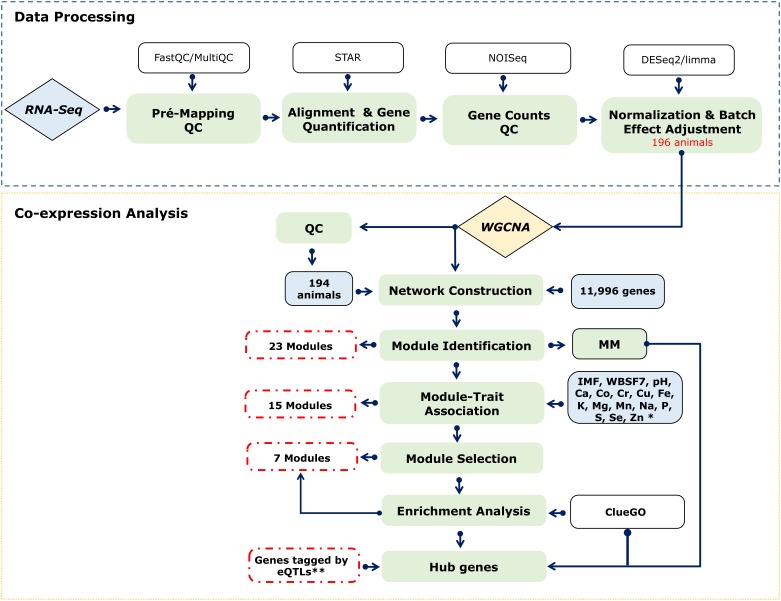
FIGURE 1.
Workflow. Green boxes represent the main analysis steps that were involved in data processing and co-expression analysis. Tools applied in each step are shown in white boxes. Inputs and outputs are shown in blue and dashed red boxes, respectively. ∗A varying number of samples was analyzed for each trait (Supplementary Table S1). ∗∗Data from an eQTL analysis carried out for the same population used in this study (Cesar et al., 2018).

