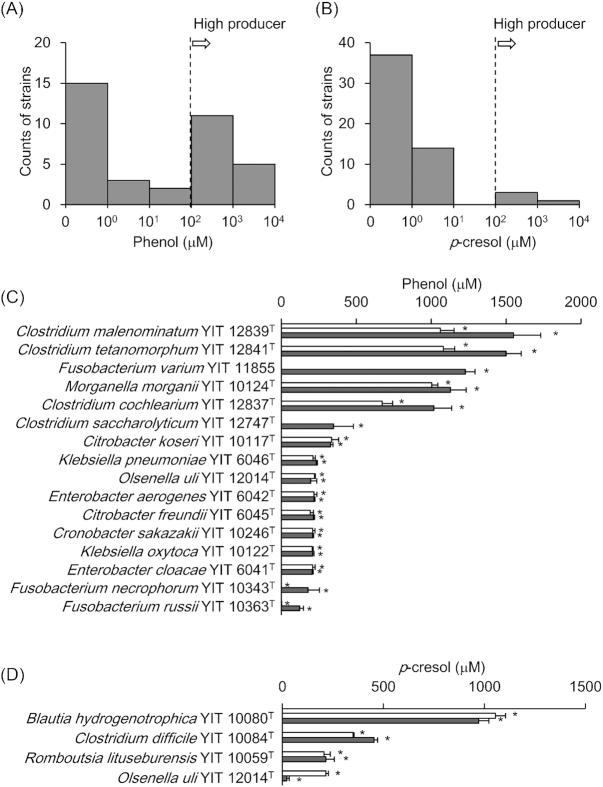
Figure 1.
Evaluation of phenol and p-cresol production ability in 153 screened strains
One-hundred fifty three strains were cultured in rich or poor medium for 6 days. The counts of (A) phenol-positive strains and (B)p-cresol-positive strains are shown as histograms. The concentrations of (C) phenol and (D)p-cresol produced in culture by high producers are shown. White bars indicate results using rich-medium; gray bars indicate those using basal medium. Error bars indicate standard deviations. Asterisks represent P < 0.05 as analyzed by Student’s t-test (increased compared with uncultured control medium).

