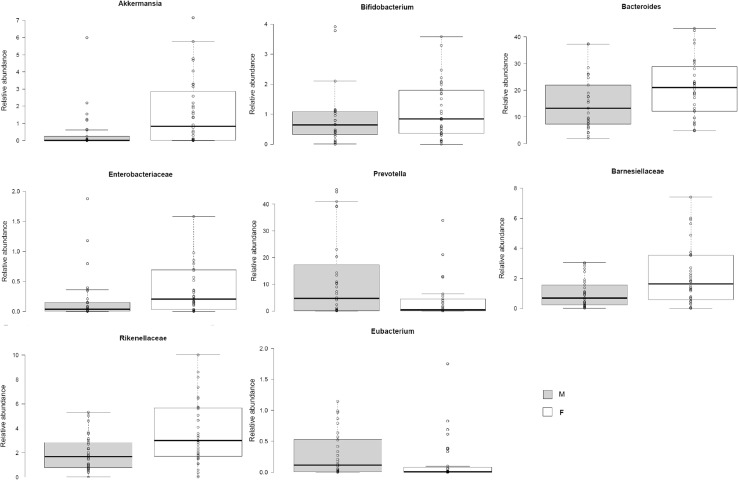
Fig. 6.
Significant differences between male (M) and female (F) in percentage relative abundance of bacterial genera after dietary intervention with olive-enriched product (OEP), according to Mann–Whitney U test. Center lines show the medians; box limits indicate the 25th and 75th percentiles as determined by R software; whiskers extend 15 times the interquartile range from the 25th and 75th percentiles; outliers are represented by dots

