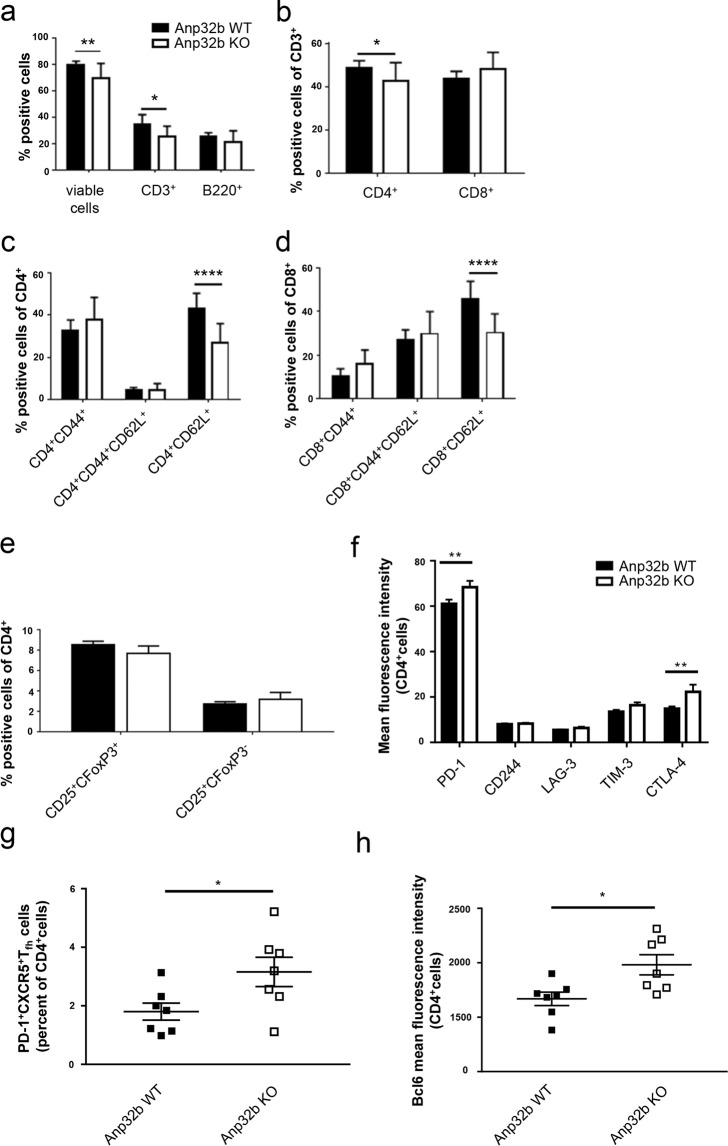
Figure 6.
Prevalence and activation status of T cell subsets. Splenocytes of mice that had experienced 60 days of EAE were analyzed as before. (a) Splenic T and B cell lymphocytes were analyzed based on CD3 and B220 expression. (b) CD3+ peripheral T cell subset was analyzed with respect to CD4 and CD8 expression. (c) Activation status of splenic CD4+ or (d) CD8+ peripheral T cells were further analyzed with respect to naive T cells and T effector memory cell subsets. (e) Splenic cells were analyzed for the percentages of CD25+Foxp3+ Tregs and CD25+ Foxp3− within their CD4+ population. (f) MOG immunized mice were examined for the expression of T cell exhaustion hallmarks. Increased co-expression of multiple inhibitory receptors of Anp32b KO animals in comparison to WT littermates. Lymph node cells were isolated 60 days after MOG immunization. PD-1, CTLA-4, LAG-3, TIM-3 and CD244 expression was analyzed by flow cytometry. (g) PD-1+CXCR5+ among the CD4+ T cells from isolated lymph nodes as described above were defined as Tfh cells. Frequencies of Tfh are shown. (h) The transcriptional repressor, Bcl-6, that directs Tfh cell differentiation, was determined by flow cytometry within the CD4+T cells. Data are mean ± SEM. For (a–e): Anp32b WT (n = 12) and Anp32b KO (n = 8); For (f–h): Anp32b WT (n = 7) and Anp32b KO (n = 7) or indicated as individual dots in (h). *p < 0.05, **p < 0.01, ***p < 0.001 ****p < 0.0001 Mann-Whitney U test.

