Fig. 1.
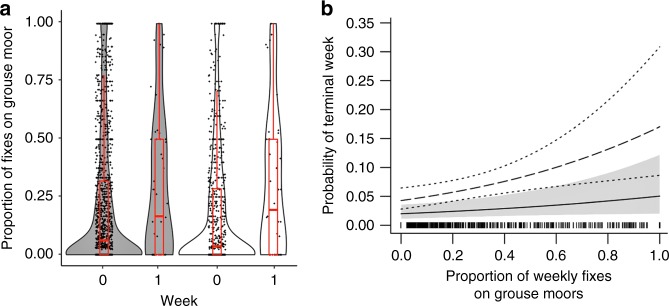
Use of grouse moors in relation to terminal weeks. a The density distribution and data spread for the weekly proportion of fixes on grouse moors during live weeks (0) and terminal weeks (1) for all tracked hen harriers (grey shaded, n = 58 individuals) and for harriers known to have been illegally killed (I) combined with those which had tags that suddenly stopped with no indication of a malfunction (SNM) (white, n = 42 individuals). Box plots (red) show the median, upper and lower quartile and whiskers (1.5× interquartile range). b The effect of grouse moor use on the probability of it being a terminal week (i.e. the probability of death or disappearance). Solid line represents all harriers with confidence intervals (CIs) shaded grey; dashed line represent I and SNM harriers only, with CIs shown by dotted lines. Source data are provided as a Source Data file

