Fig. 1.
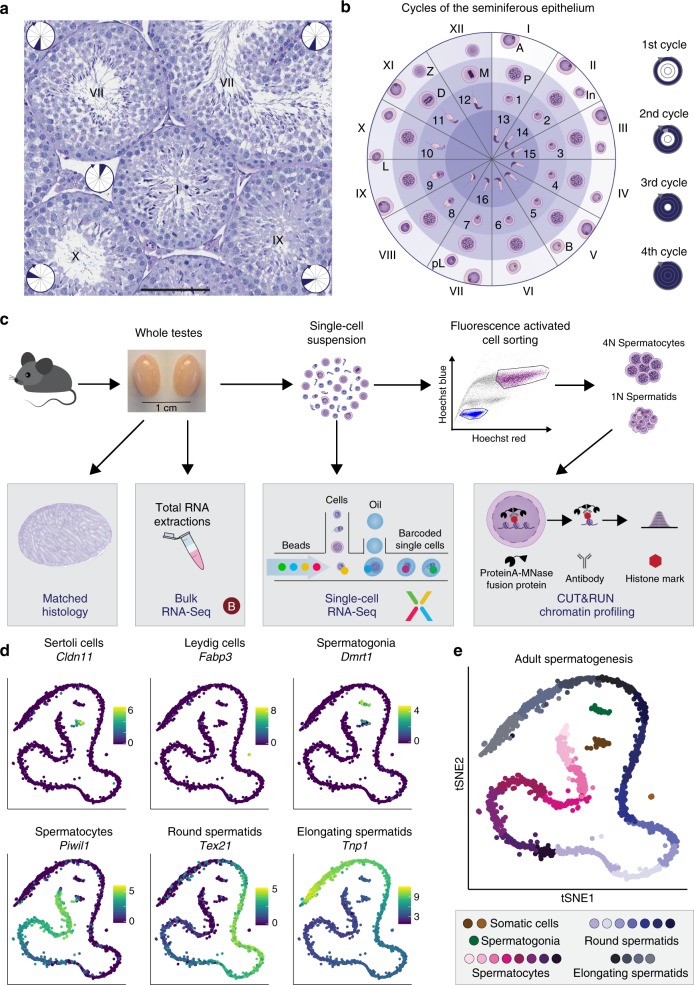
Single-cell RNA-Seq captures a continuum of germ cell-types. a Periodic Acid Schiff (PAS)-stained testis cross-section showing a number of seminiferous tubules at different epithelial stages (displayed as Roman numerals). Within each tubule, the inset circle refers to the corresponding section in (b). Scale bar represents 100 µm; original magnification ×20. b Schematic representation of the 12 stages of the seminiferous epithelium in mice. The colour gradient within the circle indicates the differentiation path of germ cells with the layers corresponding to individual cycles of the epithelium. The circle is divided into 12 sections, each corresponding to one epithelial stage displaying the characteristic germ cells. Within each section, cells are positioned across the different layers according to their emergence during consecutive cycles, each being 8.6 days apart with more mature cells moving towards the centre. Cell-types are labelled as: A: type A spermatogonia (SG), In: intermediate SG, B: type B SG, pL: pre-leptotene spermatocytes (SCs), L: leptotene SCs, Z: zygotene SCs, P: pachytene SCs, D: diplotene SCs, M: metaphase I and II, 1–8: round spermatids, 9–16: elongating spermatids. c Overview of the experimental design yielding bulk RNA-Seq, droplet-based scRNA-Seq and chromatin profiling on FACS-purified cells using CUT&RUN from one testis while using the contralateral testis for matched histology. d t-distributed stochastic neighbour embedding (tSNE) representation of scRNA-Seq data from adult B6 mice with the colour gradient representing the expression of known marker genes for two somatic cell-types and the main germ cell-types. The x- and y-axis represent the first and second dimension of tSNE respectively. The colour legend shows log2-transformed, normalised expression counts. e Graph-based clustering (Methods) identifies different sub-stages within major germ cell populations

