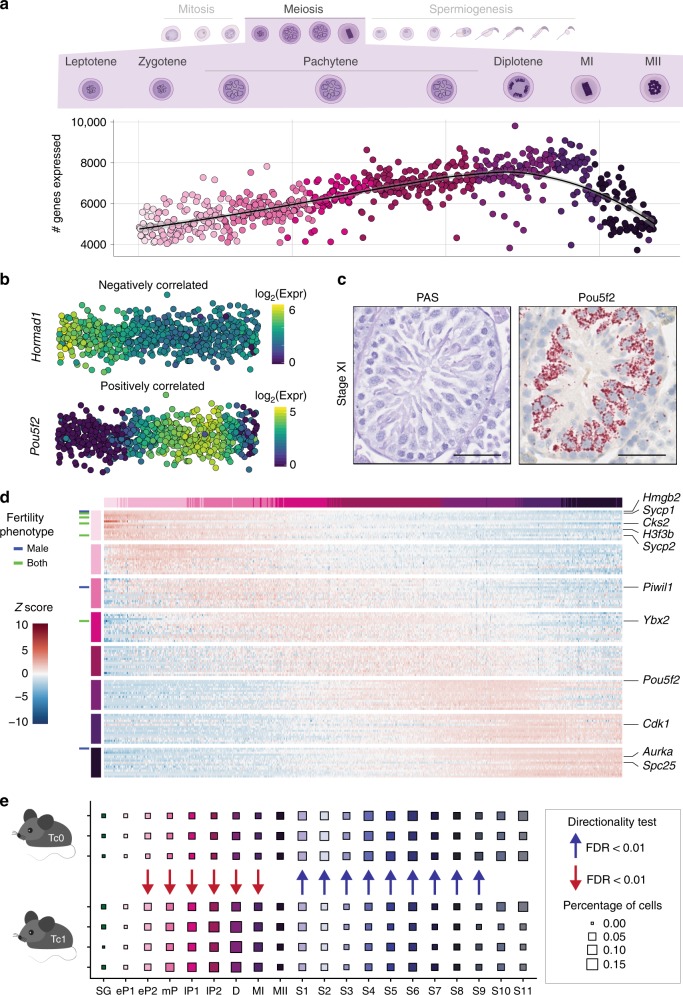
Fig. 5.
Gene expression dynamics during male meiosis. a Number of genes expressed per spermatocyte. Cells are ordered by their developmental progression during meiotic prophase until metaphase. b Example of genes that are negatively (Hormad1) or positively (Pou5f2) correlated with the number of genes expressed during meiotic prophase (Spearman’s correlation test, negatively correlated: rho < −0.3, Benjamini-Hochberg corrected empirical p-value < 0.1; positively correlated: rho > 0.3, Benjamini-Hochberg corrected empirical p-value < 0.1, see Methods). The colour gradient represents log2-transformed, normalised counts. c Representative images for Stage XI tubules from adult animals stained with PAS or RNA ISH for Pou5f2 using RNAScope. Scale bar represents 50 µm; original magnification ×40. For full quantification across tubule stages see Supplementary Fig. 7a, b. d Heatmap visualising the scaled, normalised expression of the top 15 marker genes per cell-type. Row and column labels correspond to the different populations of spermatocytes. Genes are labelled based on their fertility phenotype: blue: infertile or sub-fertile in males, green: infertile or sub-fertile in both males and females. e Cell-type proportions in each cluster for Tc0 (n = 3) and Tc1 (n = 4) animals. Arrows indicate a statistically significant shift in proportions between the genotypes (Methods). SG: spermatogonia, eP: early-pachytene spermatocyte, mP: mid-pachytene SC, lP: late-pachytene SC, D: diplotene SC, MI: meiosis I, MII: meiosis II, S1-S11: step 1–11 spermatids

