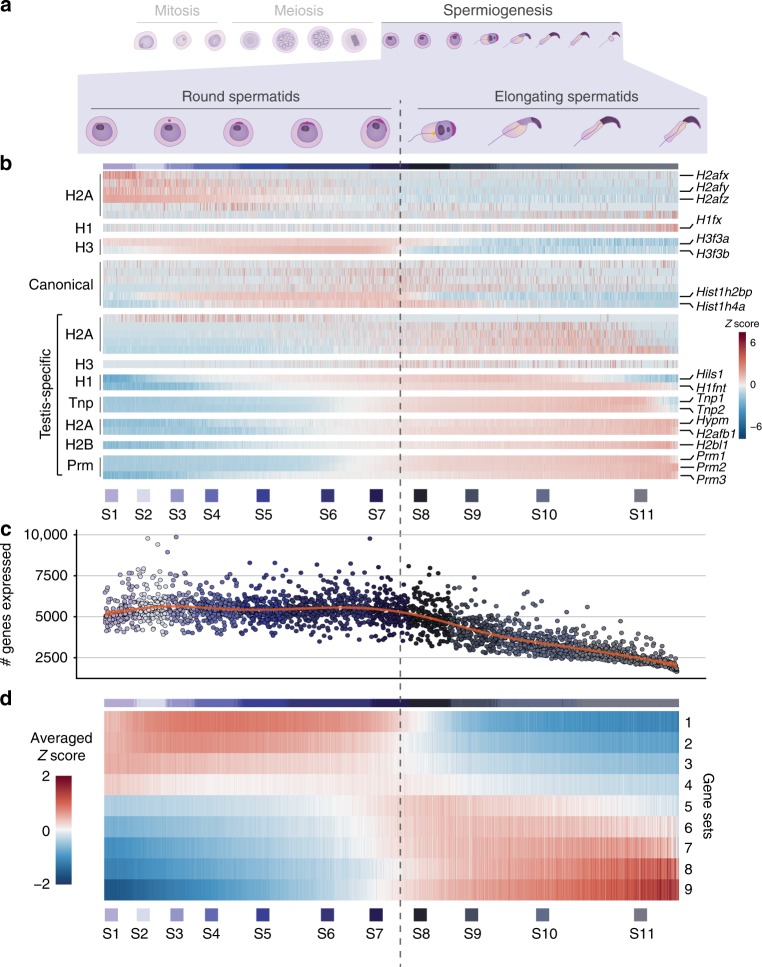
Fig. 6.
Transcriptional and chromatin dynamics during spermiogenesis. a Schematic representation of spermiogenesis indicating the round-to-elongating switch that coincides with transcriptional shutdown. b Scaled, normalised expression of histone variants (H1, H2A, H2B, H3), canonical histones, transition proteins (Tnp) and protamines (Prm) during spermiogenesis. Cells were ordered based on their developmental trajectory ranging from round spermatids (S1–S7) to elongating spermatids (S8-S11). Vertical dashed line indicates transcriptional shutdown between S7 and S8. c Number of genes expressed per spermatid. Cells were ordered based on their developmental trajectory. Red line indicates a smooth regression (loess) fit. d For each gene, its normalised expression per cell was correlated with the number of genes expressed per cell (Methods). Genes were ordered based on the correlation coefficient and grouped into nine sets (Supplementary Data 10). Scaled expression was averaged across genes within each gene set

