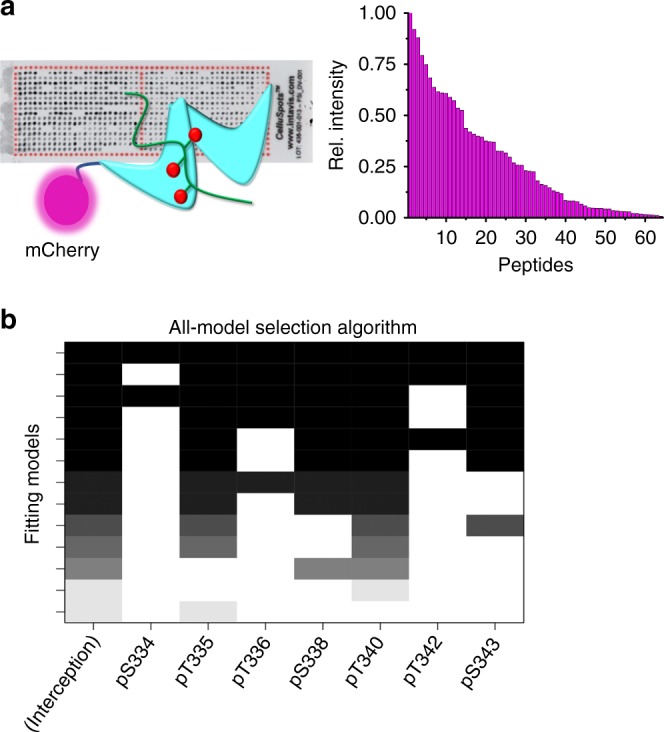
Fig. 1.

High-throughput screening of potential phosphorylation sites. a Schematic representation of the peptide array and the binding measurement using the mCherry-arrestin-1 fusion construct. Binding of the mCherry-Arrestin-1 fusion to each phosphopeptide was determined by the fluorescence at each spot on the array (barplot). b The fluorescence intensities of the acquired dataset were fitted to a linear model to determine the contribution of each position to arrestin binding. An all-subset model selection using the Akaike information criterion was used to identify the relative importance of each phosphorylation site to arrestin binding (see Methods). The plot shows the importance (fitting coefficients) of each phosphorylation site for the top 20 models (y-axis) in grayscale. The strength of the coefficient for a site in a model is indicated by the darkness of the boxes. White denotes that the coefficient was set to zero. The darker and longer columns indicate phosphorylation sites important for a tight interaction with arrestin-1. Interception represents the “non-specific” binding component
