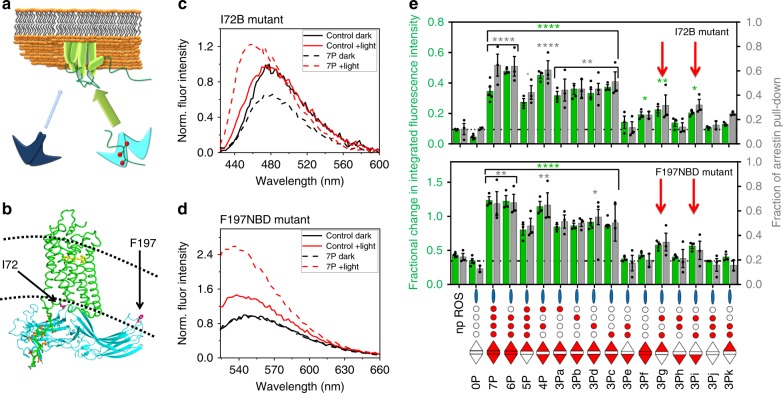
Fig. 4.
Ternary complex formation depends on peptide phosphorylation pattern. a Schematic representation of phosphopeptide-induced arrestin-1 activation and recruitment to nonphosphorylated light-activated rhodopsin in the native membrane. b Model of a complex of arrestin-1 bound to active phosphorylated rhodopsin (own work). Locations of the introduced fluorescent probes on the finger loop (I72) and C-edge (F197) are indicated, as is the membrane bilayer (dashed lines). c Steady-state fluorescence spectra of arrestin-1 mutant I72B in the presence of nonphosphorylated rhodopsin, measured in the dark-state (black spectra) and after light-activation (red spectra), in the absence (solid spectra) or presence (dashed spectra) of fully phosphorylated peptide 7P. d Steady-state fluorescence spectra of arrestin-1 mutant F197NBD, as described in (c). e Quantification of ternary complex formation using arrestin-1 mutants I72B and F197NBD as measured by fluorescence (green bars, left axes) and centrifugal pull-down analysis (gray bars, right axes). The results of a statistical analysis (ANOVA) of each peptide versus “np ROS” are indicated by green (fluorescence) and gray (pull-down) stars above each column (*P ≤ 0.05, **P ≤ 0.01 and ****P ≤ 0.0001). The red arrows indicate tri-phosphorylated peptides which lack one of the key sites pT340 or pS343 but include the weak recruiter (secondary) sites pT335 and pS338. Data represent the average± s.e.m. from three independent experiments

