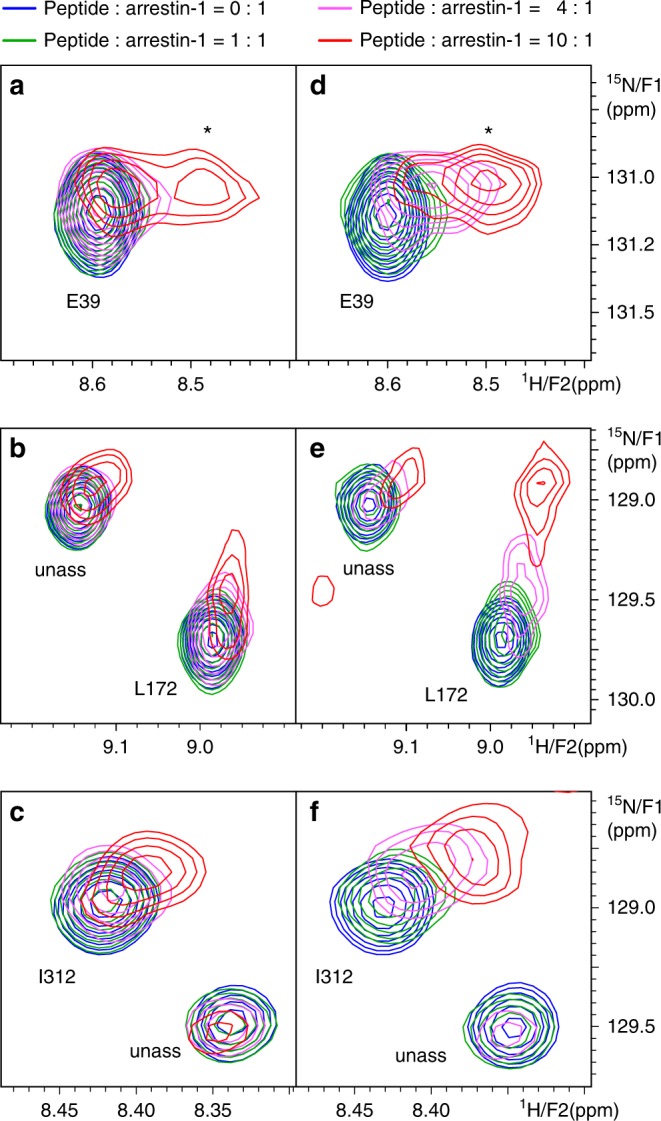
Fig. 5.

Expansions of the series of [15N,1H]TROSY spectra of arrestin-1. It shows representative chemical shift changes in arrestin-1 induced by the 3Pa peptide (a−c) and the fully phosphorylated peptide 7P (d−f, see Supplementary Figure 3 for full spectrum) for E39, L172, and I312 at peptide:arrestin-1 ratios of 0:1 (blue), 1:1 (green), 4:1 (violet), and 10:1 (red). Unassigned resonances are labeled “unass”. A second peak appearing at 10:1 in (a) and (d) which may indicate the presence of multiple states in slow exchange is marked with an asterisk
