Fig. 6.
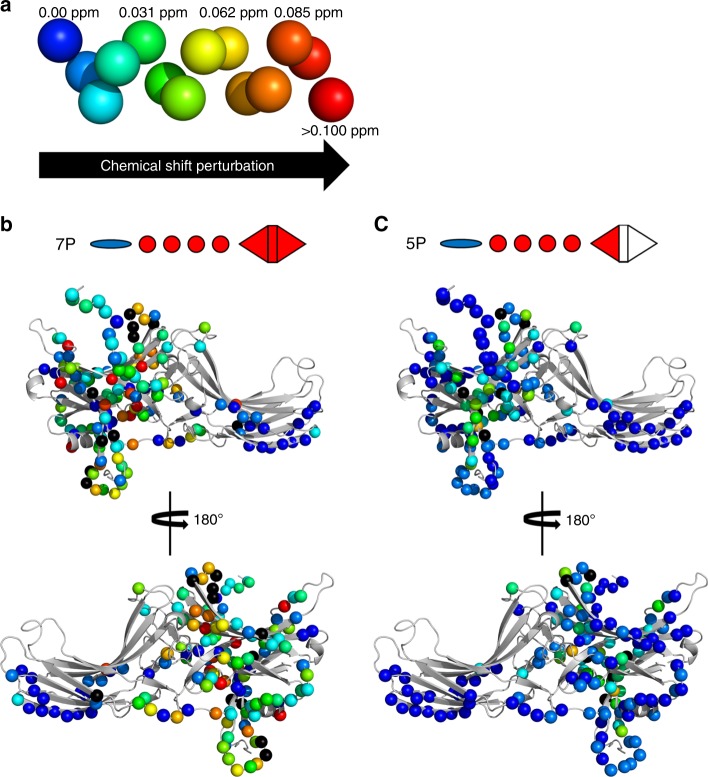
Chemical shift perturbations measured by NMR titration series. a Color code indicating the magnitude of chemical shift perturbations, which are plotted on structural models of basal arrestin-1 (PDB accession 1CF1, molecule D) in (b) and (c). The rainbow spectrum represents the range of chemical shift perturbations: nonsignificant (blue), minor (green), moderate (yellow), large (orange), and very large (red). Black marks residues whose signals showed strong line broadening which prevented the final position to be determined, indicating significant changes in mobility of the residue or its surroundings bring them to the µm-ms range. b Chemical shift perturbations measured for phosphopeptide 7P. c Chemical shift perturbations measured for phosphopeptide 5P. Note that the full-length C-terminus shown in these figures, which is not resolved in the structure, was modeled (see Methods)

