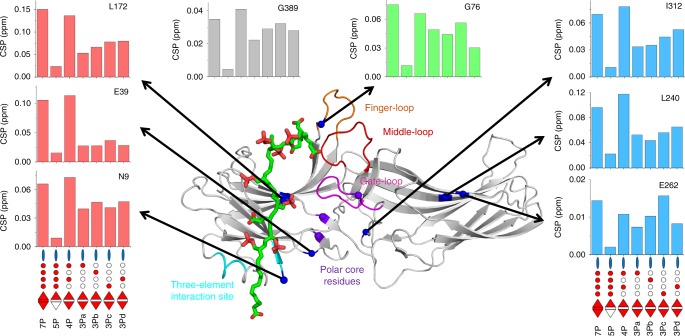
Fig. 7.
Phosphorylation patterns modulate the conformation of arrestin-1. The magnitude of chemical shift perturbations of individual residues caused by different phosphopeptides is illustrated by barplots. The locations of these residues (blue spheres) are indicated on a model of active arrestin-1 in complex with the fully phosphorylated rhodopsin C-terminal peptide (own work; negatively charged and phosphorylated residues are highlighted in red, C-terminus of peptide is at bottom). Note the location of G389 is not shown because the C-tail was not included in the model. The barplots are colored according to residue location in different functional regions of arrestin-1: on or near the polar core (red), C-tail (gray), central crest (green) and C-domain (blue). Additionally, four regions important for arrestin activation are highlighted: the finger loop (orange, G68-L77), the middle-loop (red, Q133-S142), the gate loop (magenta, D296-N305), the three-element interaction (cyan, H10-I13, L107-L111) and the polar core (purple spheres, R175, D30, D303)

