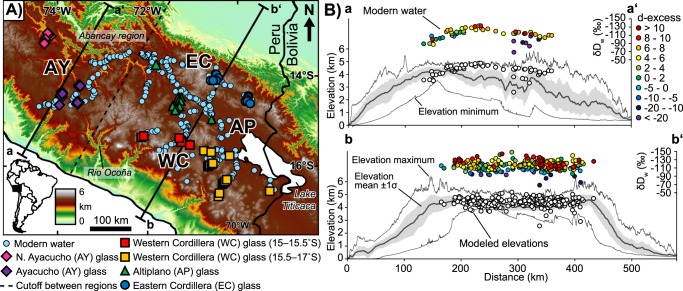
Figure 1.
Study area, sample locations, and modern water elevation modeling. (A) Digital elevation model showing the northern extent of the Andean plateau generated from Shuttle Radar Topography Mission (SRTM) 90 m elevation data. Physiographic regions characterizing the central Andes: AY = Ayacucho, WC = Western Cordilleran, AP = Altiplano. EC = Eastern Cordillera. Topographic swaths along a–a’ and b–b’ are 140 and 340 km wide, respectively; the dashed line is an arbitrary cutoff between the topographic swaths and modern water data. Modern water data include results from Bershaw42 and volcanic samples include results from Saylor and Horton12. (B) Topographic swaths showing mean, minimum, maximum, and 1σ standard deviation elevation. Modern water measurements are color-coded to d-excess values. White circles are mean catchment elevations calculated from modern waters using a modified non-linear isotopic lapse rate43.

