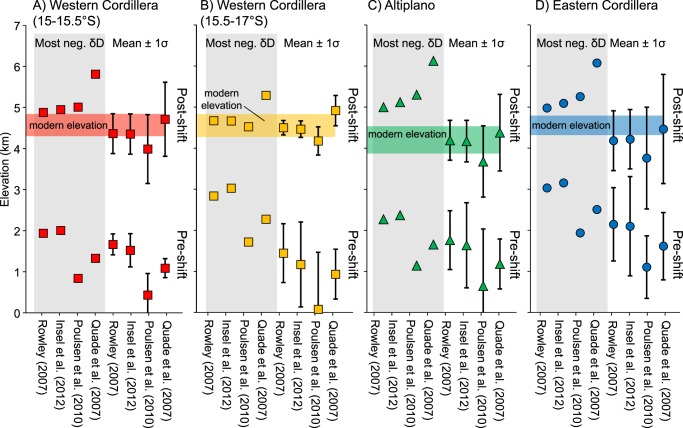
Figure 6.
Surface uplift estimates for each physiographic region based on lapse rates in Fig. 5. Estimates are calculated based on the most negative and mean pre-shift (>−90‰) and post-shift (<−90‰) water-glass fractionation corrected dDpw values33. Estimates take into account Oligocene – Pleistocene global cooling climate correction (see text and Supplementary Information for details). Shaded horizontal colored bars are ±1σ standard deviation of modern elevation.

