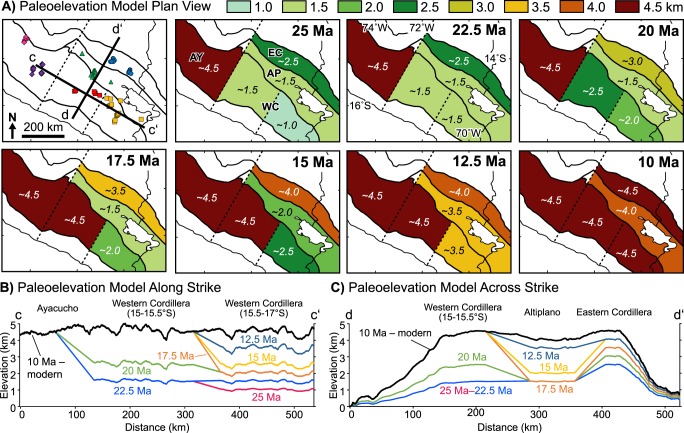
Figure 8.
Paleoelevation model showing variable surface uplift history of the Peruvian central Andes at resolution of general circulation models in (A) map view and cross section (topographic profile) view (B) along strike (c–c’) and (C) across strike (d–d’). Topographic profiles were calculated by multiplying the modern mean topography by percentage elevation through time with boundaries linearly interpolated between physiographic regions. Dashed lines are arbitrarily drawn to separate the Ayacucho region and the central and southern Western Cordillera.

