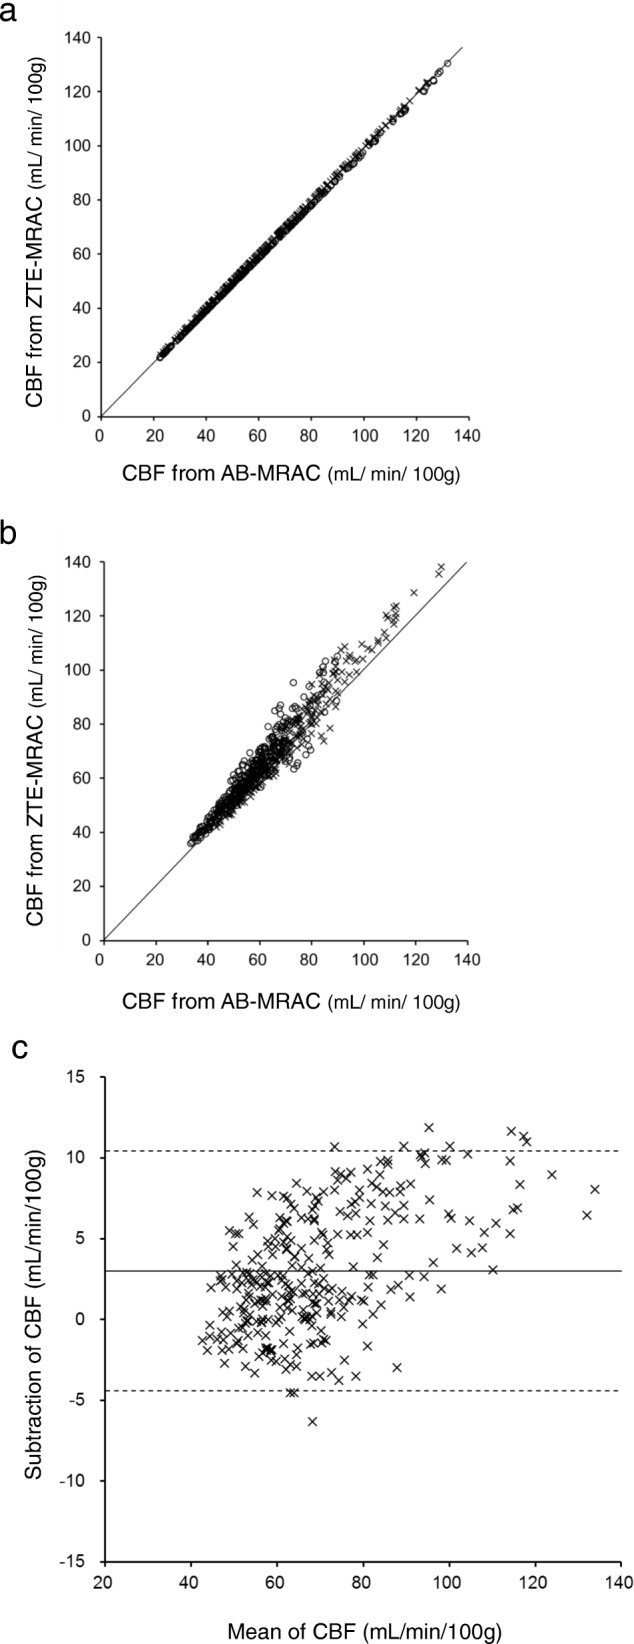
Fig. 5.

Two representative regression analyses for regional CBF obtained from 310 ROIs for all brain regions (see Table 1). The first case (a) showed excellent correlation at baseline (○: y = 0.99x + 0.48, R2 = 1.0) as well as after acetazolamide administration (×: y = 0.99x + 0.13, R2 = 1.0). Several cases showed slightly greater variance, as shown in panel (b), although the correlation coefficient was excellent (baseline (○): y = 1.1x + 4.5, R2 = 0.96; acetazolamide (×): y = 1.1x + 1.3, R2 = 0.90). Graph c shows the Bland-Altman plot for the second case which had no significant bias, although the AB-MRAC CBF image tended to show greater values in the higher range of the CBF mean (mean difference 3.0 ± 3.8; range − 4.4–10.4 mL/min/100 g)
