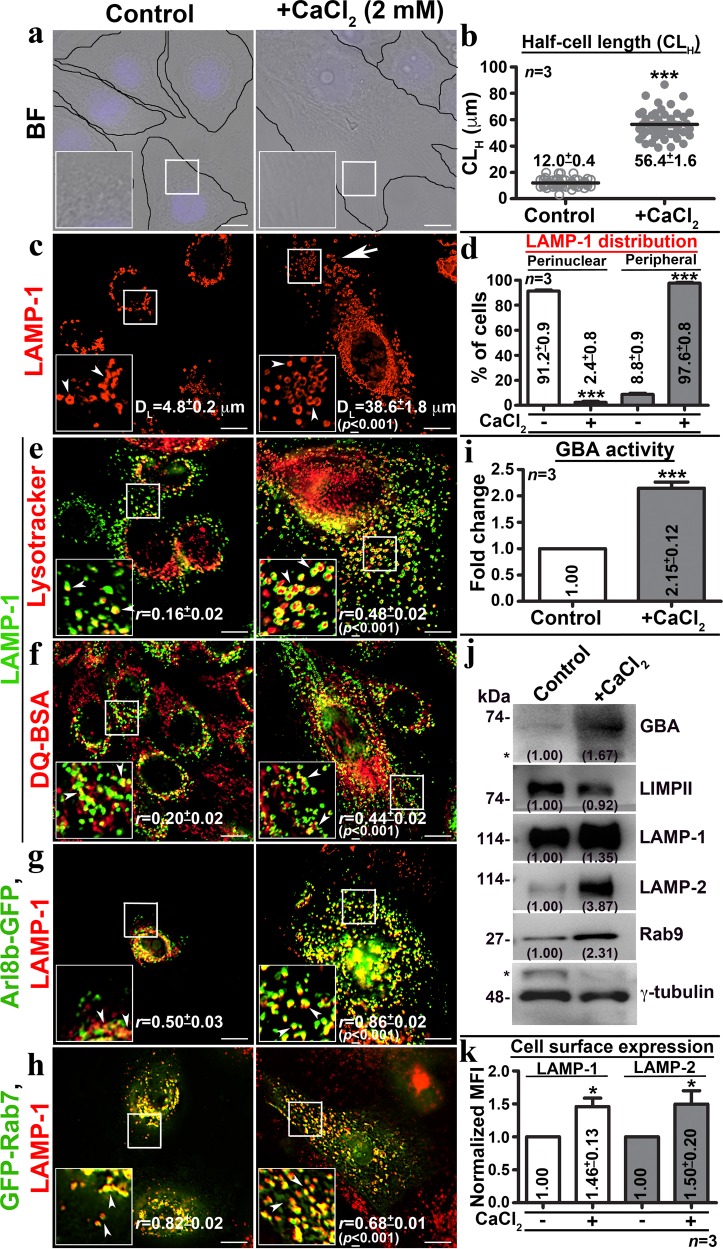
Fig. 1. Calcium chloride incubation induces cellular differentiation and increases active enlarged lysosomes in human primary keratinocytes.
a BF analysis of control and CaCl2-incubated (at ~60 h) cells. b CLH (in µm) was measured (~60 cells, n = 3) in each condition and then plotted (mean ± s.e.m). c IFM analysis of LAMP-1 stained control and differentiated keratinocytes. Arrowheads point to LAMP-1 compartments and arrow indicates their distribution and increased number in differentiated cells. DL (in µm) in each condition was measured (~60 cells, n = 3) and indicated (mean ± s.e.m.). d The cellular distribution of LAMP-1 organelles was quantified visually (~100 cells, n = 3) and then plotted (mean ± s.e.m). e–h IFM analysis of keratinocytes internalized with either lysotracker or DQ-BSA, or transfected with Arl8b-GFP or GFP-Rab7, fixed and stained for LAMP-1. Arrowheads point to the LAMP-1-positive organelles. The degree of colocalization (Pearson’s coefficient, r) between markers is indicated separately (mean ± s.e.m., n = 3). Nuclei are stained with Hoechst 33258 and the insets are magnified view of the white boxed areas. Scale bars, 10 μm. i Glucocerebrosidase (GBA) activity was normalized with cell number and then plotted (fold change in mean ± s.e.m., n = 3). j Immunoblotting analysis of keratinocytes. The fold change in protein levels is indicated. * Indicates non-specific bands detected by the antibodies. k Cell surface levels of LAMP-1 and −2 in control and differentiated cells. Fold change in mean fluorescence intensity (MFI) was calculated (n = 3 in quadruplicates) and then plotted (mean ± s.e.m.). *p ≤ 0.05 and ***p ≤ 0.001

