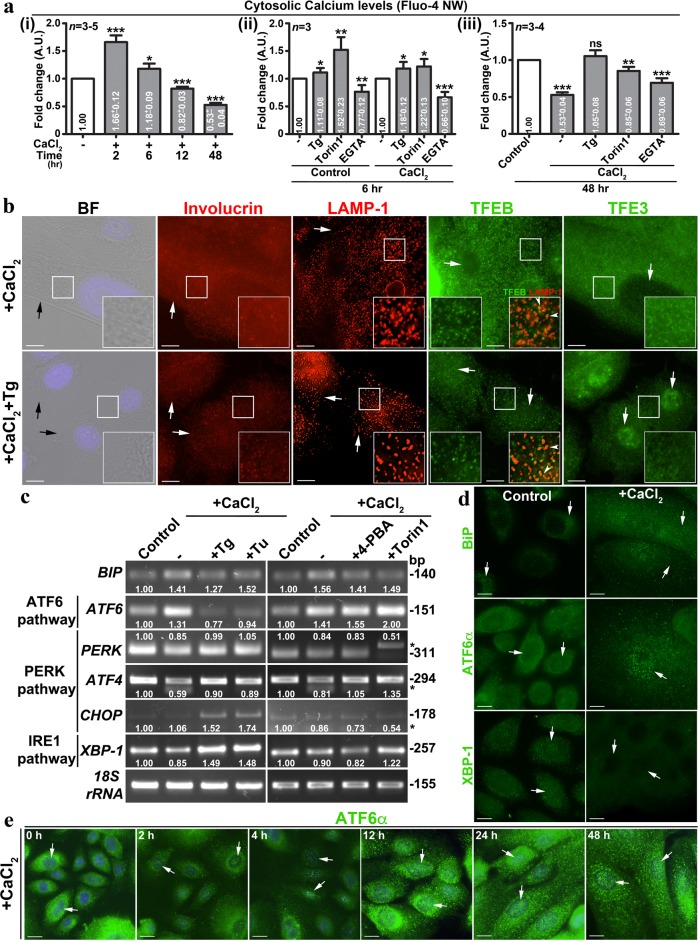
Fig. 4. Differentiation of keratinocytes elevates cytosolic calcium at early phase and activates UPR TF ATF6α.
a Measurement of intracellular calcium in keratinocytes at different time points of differentiation. In (i), cells were treated with CaCl2 for respective time points. In (ii and iii), cells were incubated with the indicated compounds alone or coincubated with CaCl2 for the respective time points. In all conditions, cells were incubated with Fluo-4 NW for 2–3 h either prior to or during the treatment condition. The fold change (mean ± s.e.m.) in fluorescence intensities is indicated. Note that EGTA was used as the negative control in the experiments. *p ≤ 0.05; **p ≤ 0.01; ***p ≤ 0.001 and ns, not significant. b BF and IFM analysis of keratinocytes that were incubated with CaCl2 alone or CaCl2 with Tg for 48 h. Black arrows point to the cell limit. White arrows indicate the expression of proteins or distribution of lysosomes or localization of respective TFs to the nucleus. Arrowheads point to the localization of TFEB to the lysosomes. c Transcript analysis of ER stress genes in the keratinocytes that were treated with either CaCl2 alone or CaCl2 with the indicated compounds for 48 h. The fold change in gene expression is indicated. * Indicates non-specific bands. d, e IFM analysis of keratinocytes that were incubated with CaCl2 for 48 h (d) or indicated time points (e). White arrows indicate the expression of BIP or localization of respective TFs to the nucleus. Nuclei are stained with Hoechst 33258 and the insets are magnified view of the white boxed areas. Scale bars, 10 μm

