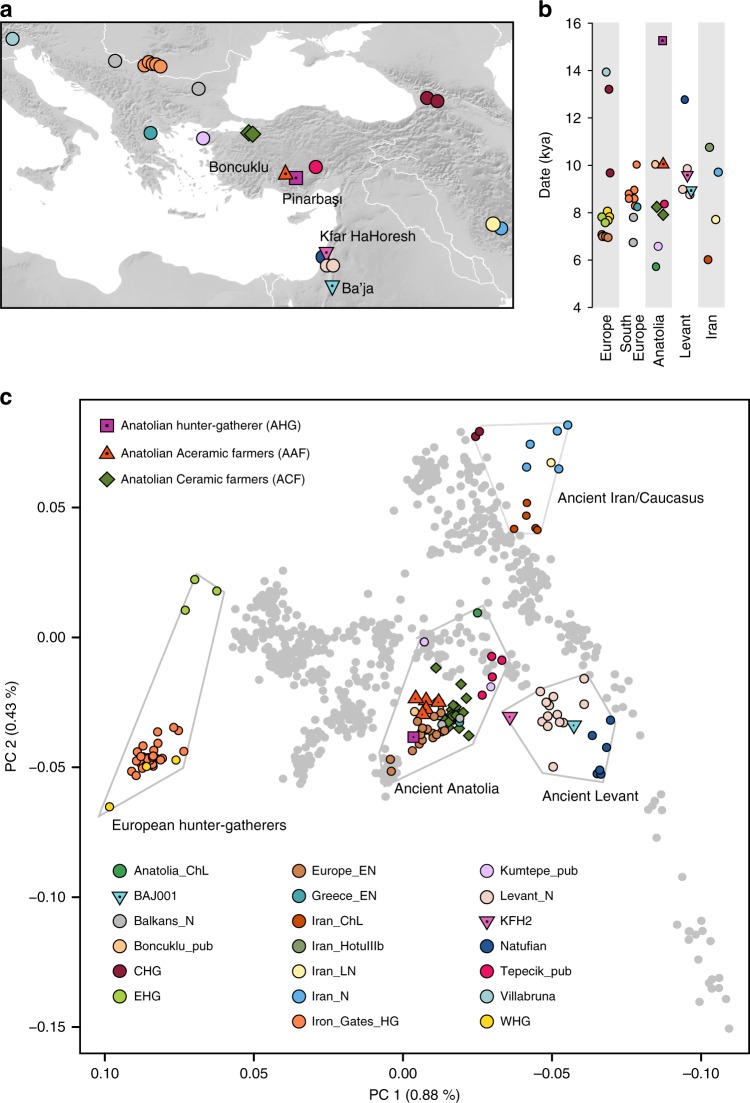
Fig. 1.
Location, age, and principal component analysis (PCA) of analyzed individuals. a Locations of newly reported and selected published genomes. Archeological sites from which new data are reported are annotated. Symbols for the analyzed groups are annotated in c. b Average ages of ancient groups. c Ancient genomes (marked with color-filled symbols) projected onto the principal components computed from present-day west Eurasians (gray circles) (Supplementary Figure 8). The geographic location of each ancient group is marked in a. Ancient individuals newly reported in this study are additionally marked with a black dot inside the symbol. Source data are provided as a Source Data file

