Figure 1.
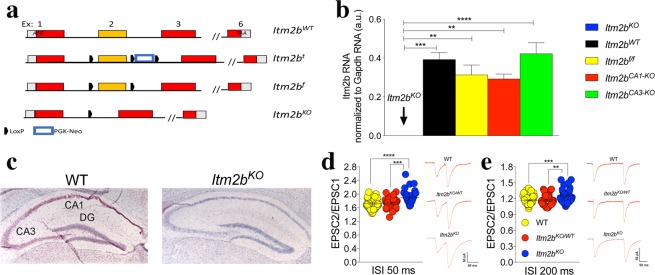
Loss of Bri2 increases synaptic facilitation at hippocampal SC–CA3 > CA1 synapses. (a) Schematic representation of the strategy used to generate mice carrying the Itm2bKO and Itm2bf alleles. Boxes represent exons (exons 4 and 5 are omitted to save space): coding regions are in red, 5′ and 3′ untranslated regions are in grey. LoxP and PGK-Neo are also depicted. (b) RT-PCR shows that Itm2b messenger RNA is undetectable in Itm2bKO mice (n = 3, 2 females and one male) and that Itm2bf/f (n = 5, 3 males and 2 females), Itm2bCA1-KO (n = 5, 3 males and 2 females) and Itm2bCA3-KO (n = 5, 3 males and 2 females) (see experiments shown in Fig. 4 for a description of these mouse lines) mice express Itm2b mRNA levels similar to WT animals (n = 5, 3 males and 2 females). Data represent means ± SEM. Data were analyzed by Ordinary one-way ANOVA. ANOVA summary of RT-PCR: F = 11.65, adjusted P value < 0.0001 (significant = ****). Post-hoc Tukey’s multiple comparisons test: WT vs. Itm2bKO adjusted P value = 0.0001 (significant = ***); Itm2bf/f vs. Itm2bKO adjusted P value = 0.0014 (significant = **); Itm2bCA1-KO vs. Itm2bKO adjusted P value = 0.0028 (significant = **); Itm2bCA3-KO vs. Itm2bKO adjusted P value < 0.0001 (significant = ****); WT vs. Itm2bf/f adjusted P value = 0.6574 (not significant); WT vs. Itm2bCA1-KO adjusted P value = 0.443 (not significant); WT vs. Itm2bCA3-KO adjusted P value = 0.9841 (not significant); Itm2bf/f vs. Itm2bCA1-KO adjusted P value = 0.9959 (not significant); Itm2bf/f vs. Itm2bCA3-KO adjusted P value = 0.3605 (not significant); Itm2bCA1-KO vs. Itm2bCA3-KO adjusted P value = 0.2074 (not significant). (c) In situ hybridization shows loss of Itm2b messenger RNA in all hippocampal cells in Itm2bKO mice. Neurons are stained in blue with Haemotoxylin and Eosin, Itm2b messenger RNA is stained in red. (c) Average PPF (2nd EPSP/1st EPSP) at 50 milliseconds (ms) (number of recordings were: 40, 30 and 36 for Itm2bWT/WT, Itm2bKO/WT and Itm2bKO mice, respectively) and 200 ms (number of recordings were: 32, 21 and 30 for Itm2bWT/WT, Itm2bKO/WT and Itm2bKO mice, respectively) of the inter-stimulus intervals (ISI). Representative traces of evoked EPSCs are shown (traces are averaged from 20 sweeps). All data represent means ± SEM. Data were analyzed by Ordinary one-way ANOVA. ANOVA summary of 50 ms ISI: F = 11.68, adjusted P value < 0.0001 (significant = ****). Post-hoc Tukey’s multiple comparisons test: WT vs. Itm2bKO/WT adjusted P value = 0.9562 (not significant); WT vs. Itm2bKO adjusted P value < 0.0001 (significant = ****); Itm2bKO/WT vs. Itm2bKO adjusted P value = 0.0006 (significant = ***). ANOVA summary of 200 ms ISI: F = 9.611, adjusted P value < 0.001 (significant = ***). Post-hoc Tukey’s multiple comparisons test: WT vs. Itm2bKO/WT adjusted P value = 0.9976 (not significant); WT vs. Itm2bKO adjusted P value = 0.0004 (significant = ***); Itm2bKO/WT vs. Itm2bKO adjusted P value = 0.0014 (significant = **).

