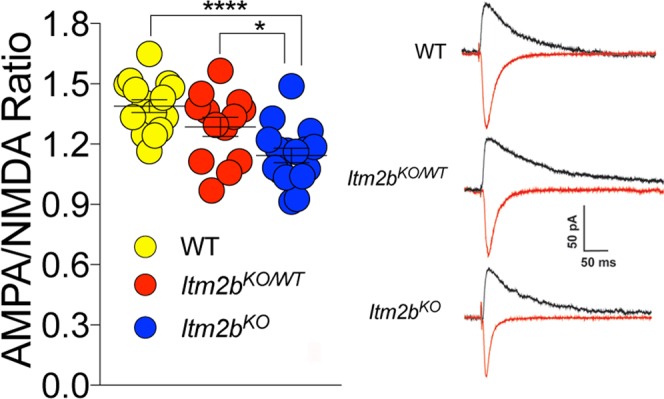
Figure 3.

Loss of Bri2 decreases the AMPA/NMDA ratio at hippocampal SC–CA3 > CA1 synapses. AMPA/NMDA ratio is significantly reduced in Itm2bKO mice. Number of recordings were: 16, 13 and 16 for Itm2bWT/WT, Itm2bKO/WT and Itm2bKO mice, respectively. Representative traces of AMPA and NMDA responses are shown on the right of the graph. All data represent means ± SEM. Data were analyzed by Ordinary one-way ANOVA. ANOVA summary, F = 11.13, adjusted P value = 0.0001 (significant = ***). Post-hoc Tukey’s multiple comparisons test: WT vs. Itm2bKO/WT adjusted P Value = 0.1582 (not significant); WT vs. Itm2bKO adjusted P Value < 0.0001 (significant = ****); Itm2bKO/WT vs. Itm2bKO adjusted P Value = 0.0356 (significant = *).
