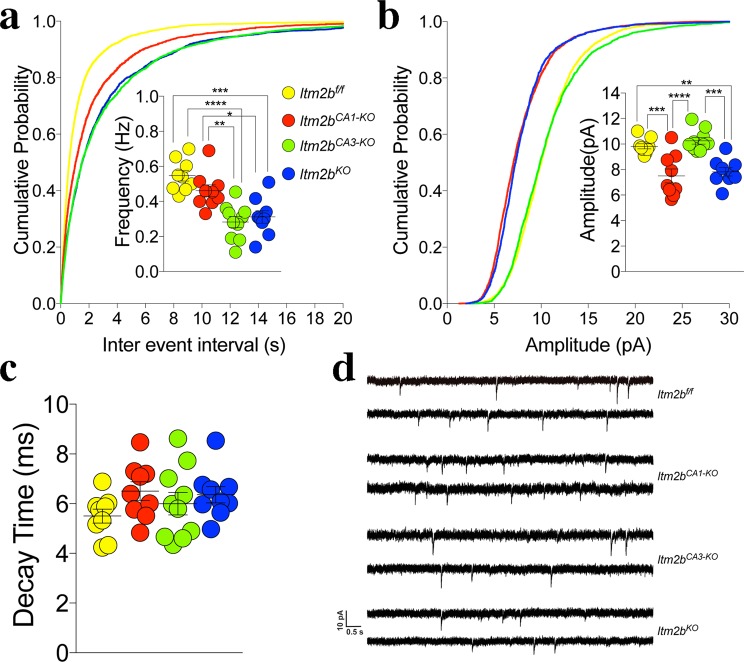
Figure 5.
Frequency and amplitude of mEPSCs are reduced by pre- and post-synaptic deletion of Bri2, respectively. (a) Cumulative probability of AMPAR mediated mEPSC inter-event intervals. Inset in cumulative probability graphs represents average mEPSC frequency. (b) Cumulative probability of AMPAR-mediated mEPSC amplitudes. Inset in cumulative probability graphs represents average amplitudes. (c) Decay time of mEPSC. (d) Representative traces of mEPSCs. Number of mEPSCs recordings were: 9, 9, 10 and 9 for Itm2bf/f, Itm2bCA1-KO, Itm2bCA3-KO and Itm2bKO mice, respectively. Data were analyzed by Ordinary one-way ANOVA. ANOVA summary of mEPSCs frequency: F = 14.46, adjusted P value < 0.0001 (significant = ****). Post-hoc Tukey’s multiple comparisons test: Itm2bf/f vs. Itm2bCA1-KO adjusted P Value = 0.2848 (not significant); Itm2bf/f vs. Itm2bCA3-KO adjusted P Value < 0.0001 (significant = ****); Itm2bf/f vs. Itm2bKO adjusted P Value = 0.001 (significant = ***). Itm2bCA1-KO vs. Itm2bCA3-KO adjusted P Value = 0.0025 (significant = **); Itm2bCA1-KO vs. Itm2bKO adjusted P Value = 0.0167 (significant = *); Itm2bCA3-KO vs. Itm2bKO adjusted P Value = 0.9204 (not significant). ANOVA summary of mEPSCs amplitude: F = 15.43, adjusted P value < 0.0001 (significant = ****). Post-hoc Tukey’s multiple comparisons test: Itm2bf/f vs. Itm2bCA1-KO adjusted P Value = 0.0004 (significant = ***); Itm2bf/f vs. Itm2bCA3-KO adjusted P Value = 0.8203 (not significant); Itm2bf/f vs. Itm2bKO adjusted P Value = 0.0022 (significant = **). Itm2bCA1-KO vs. Itm2bCA3-KO adjusted P Value < 0.0001 (significant = ****); Itm2bCA1-KO vs. Itm2bKO adjusted P Value = 0.9203 (not significant); Itm2bCA3-KO vs. Itm2bKO adjusted P Value = 0.0001 (significant = ***). ANOVA summary of mEPSCs decay time: F = 1.419, adjusted P value = 0.255 (not significant).

