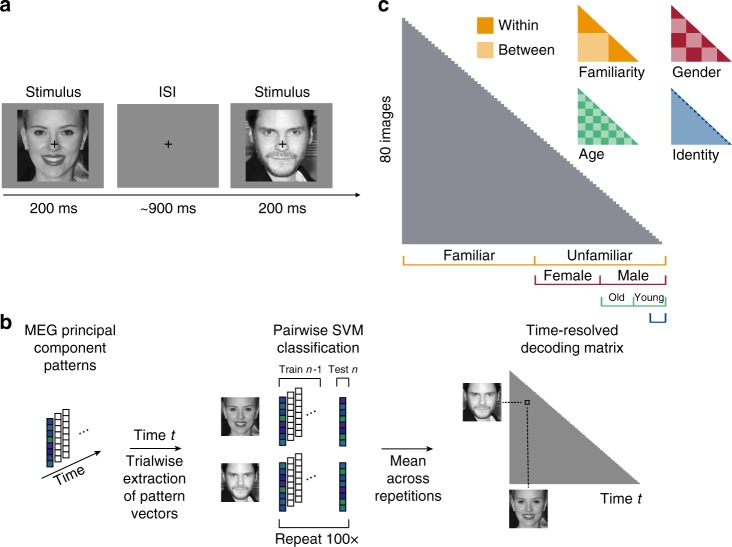
Fig. 1.
Task and multivariate MEG analyses. a Subjects viewed 80 images of faces while performing a 1-back task on the image. Each image was presented for 200 ms, followed by a variable [800–1000 ms] interstimulus interval (ISI). b MEG analyses were performed in a time-resolved manner on principal components (PCs) extracted from all MEG sensors, separately for each subject (see Methods section). For each time point t, we extracted the pattern of response across PCs for each condition and each trial and performed pairwise cross-validated SVM classification. The resulting decoding accuracy values resulted in an 80 × 80 representational dissimilarity matrix (RDM) for each time point. c To perform representational similarity analysis (RSA), we constructed model RDMs for each face dimension (1 corresponding to between and 0 corresponding to within category, respectively). Images shown are not examples of the original stimulus set due to copyright; the exact stimulus set is available at [https://osf.io/gk6f5/]. Images shown are in public domain and available at [https://commons.wikimedia.org]

